Boston's Housing Boom Is Slowing. Why Does Everything Still Feel So Expensive?
Why Greater Boston can have more apartments, a rental market much tighter than the nation's, and a $50 million public investment in one stalled development, all at the same time.
In this article
Open listings in Somerville, Medford or Quincy and you might spot something that felt rare a few years ago: a free-month offer. Another two-bedroom might sit online long enough for you to wonder whether the asking rent will budge. Then you add parking, heat and the prospect of a higher renewal, and it still feels expensive. For a buyer, a few more listings do not make the mortgage payment affordable overnight.
That mismatch is the central finding of the 2026 Greater Boston Housing Report Card (opens in a new tab), released November 10 by the Boston Foundation, Boston Indicators and researchers at Harvard's Joint Center for Housing Studies. A recent wave of completed homes has ebbed, demand is slowing, rental vacancies are edging up, and prices remain beyond the comfortable reach of many households. The interesting question is not just whether homes are being built. It is when, where, how quickly, and whether enough people can actually pay for them.
The new report estimates that Greater Boston added 15,241 net housing addresses between July 2025 and July 2026, down from 29,024 in the previous year. That is a 47.5% decline, but the region added 15,050 the year before the peak. We should not mistake a decline from an extraordinary year for proof that homebuilding has collapsed. What we can do is step back, measure the longer trend and look for the warning signs underneath.
Greater Boston is adding homes, but how much of the recent boom was normal?
It is tempting to reach for a neat chart showing a full decade of annual homes completed across Greater Boston. The data do not quite allow that. The Housing Report Card's five-county Census Address Count series begins with an April 2020 baseline and does not provide separate observed totals for every year between 2020 and 2023. We should not stretch it back to 2015, nor substitute City of Boston completions for the rest of the region.
Here is what the regional data actually show. Across Essex, Middlesex, Norfolk, Plymouth and Suffolk counties, net housing addresses grew by 86,376 between April 2020 and July 2026. That's about 13,820 a year on average across 6.25 years, not a ten-year historical norm. The early portion averaged an estimated 8,316 per year from April 2020 through July 2023; the following annual periods added 15,050, 29,024 and 15,241, respectively.
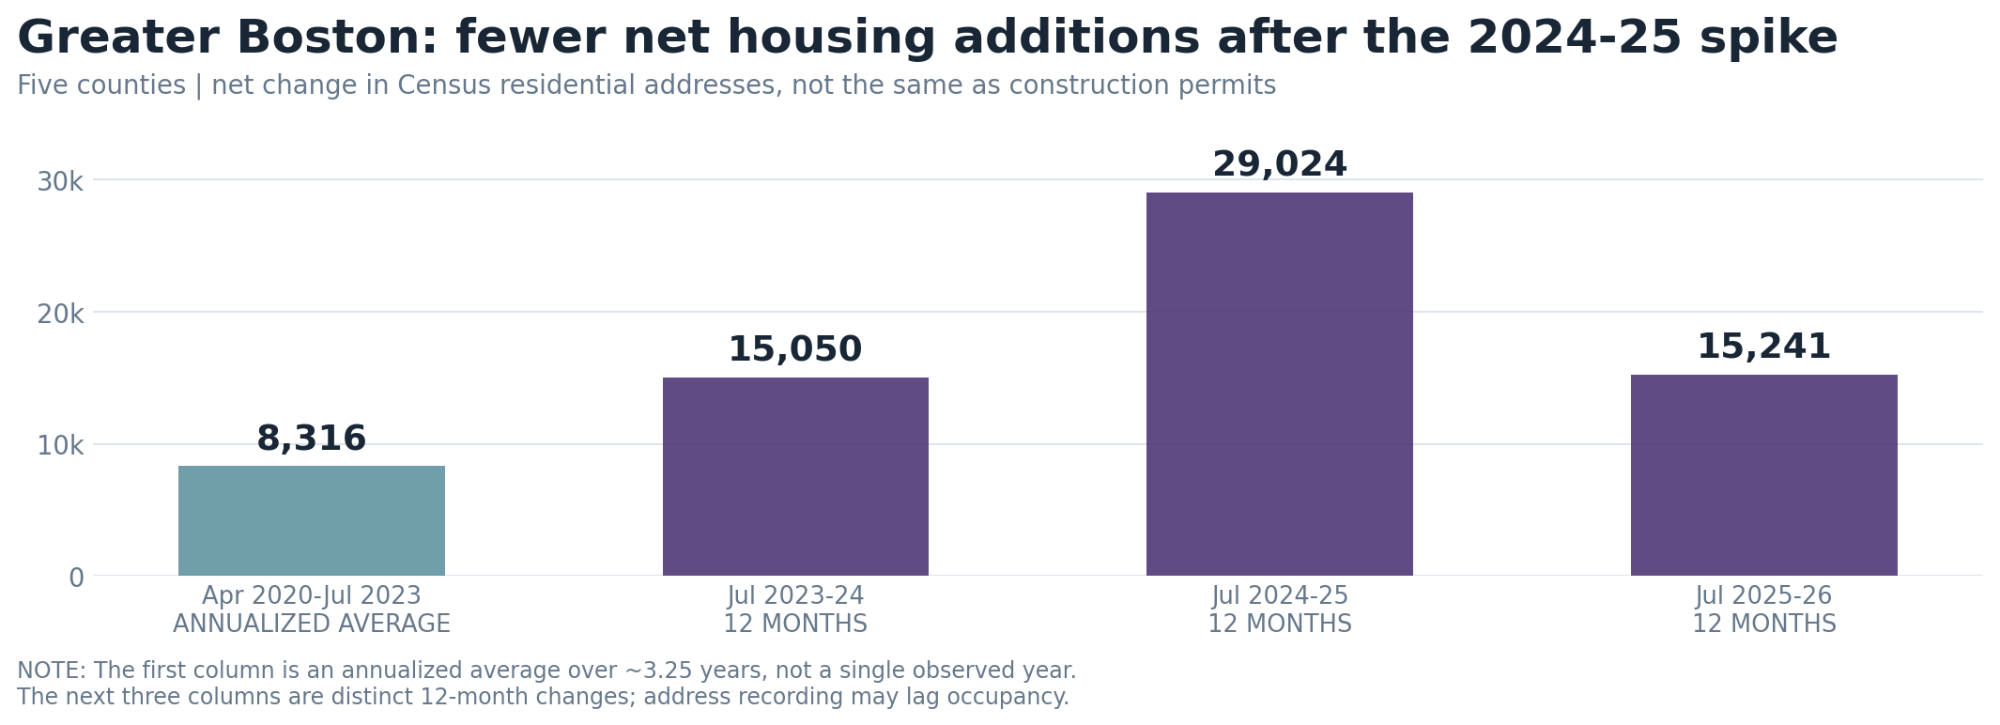
The leap to 29,024 was dramatic. The subsequent 47.5% decline was also dramatic. Yet the latest 15,241 count is nearly identical to the 15,050 reported for the period before that spike. The better interpretation is that Greater Boston appears to have come down from an unusually large wave of deliveries, not that homebuilding went to zero. The Census itself cautions that changes in its address files may not correspond exactly with when residents received keys.
Where those homes were added matters. From 2020 through 2026, the report finds the net housing stock in Metro Core communities grew 6.5%, compared with 2.9% in its Streetcar Suburbs category, based on the regional planning agency's community classifications. Put another way, the denser core's percentage increase was about 2.2 times as large. That does not mean every core neighborhood built more than every suburb, but it challenges the assumption that every close-in community is carrying an equal share of new housing.
What about a decade-long baseline? The consistent long-running data here are housing permits, not completed homes, and they appear in the next chart. We can compare the direction of the two indicators, but treating a 2018 permit as a home available in 2018 would mislead readers.
There is a practical explanation for the timing: a new apartment community renting units today may have been approved and financed years ago, before today's construction and borrowing costs. The building you can tour this month reflects the market developers faced years earlier.
Compare the permits: this is where the warning signs become clearer
A housing permit is not an apartment you can move into. It's permission to build, often followed by financing, construction, inspections and occupancy approval. Some permitted projects stall or never proceed. Permits still help us see the direction of the future pipeline, especially for large apartment developments that take years to deliver.
Greater Boston permitted an estimated 7,746 homes in 2025, the lowest total in the report's 2015-2025 annual series and about 43% below 2015. Another view, which compares the same January-August window each year, shows that 2026 permits rebounded to an estimated 6,783 from 4,817 in 2025. That is an apparent 40.8% increase, but more than half the recent permit totals in this series were statistically estimated by Census because municipal reporting was incomplete. A partial rebound is possible, not established.
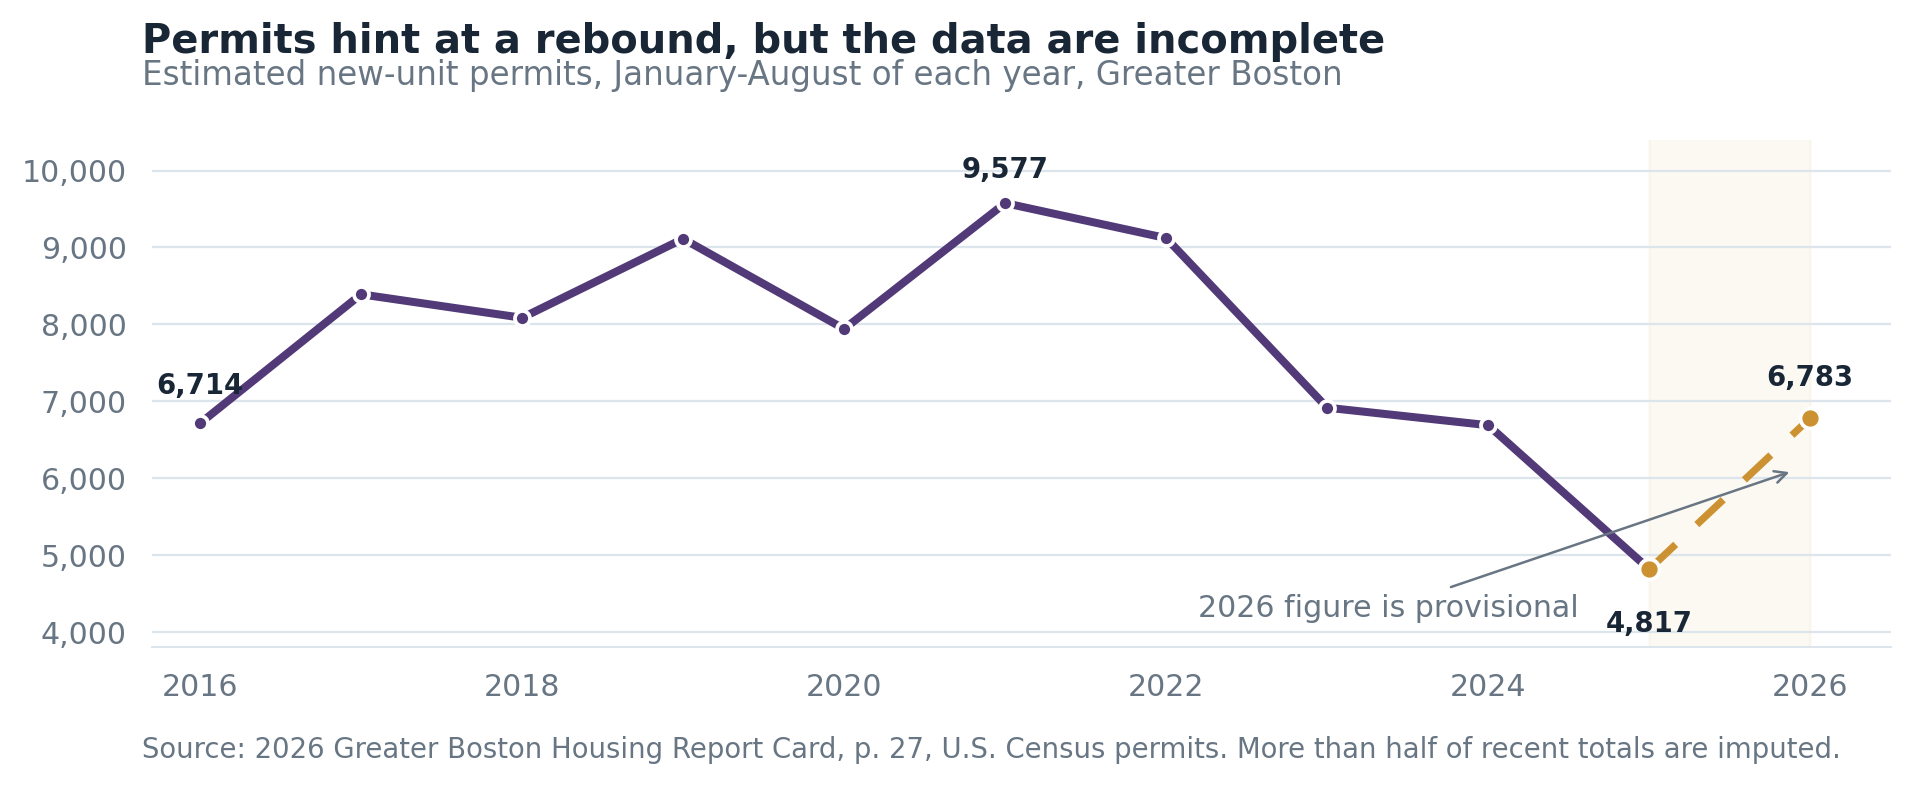
The important question is how long it takes a permit to become a home. The Census Bureau's 2025 construction survey (opens in a new tab) puts the Northeast's average multifamily permit-to-completion time at about 21.9 months. This is a regional average for buildings that reached completion, not a Boston-specific guarantee, and it excludes the potentially lengthy period before permit issuance. Massachusetts housing officials use approximate planning assumptions of one year for single-family homes, 18 months for two-to-four-unit buildings and two years for larger multifamily buildings. Those lags help explain why 2025's weak permitting could show up as fewer homes in 2027 or 2028, while the preliminary 2026 permitting rebound might help later. Not every project gets built, and the permit survey misses or estimates activity in some municipalities.
The larger problem is that the pipeline might be thinner just as Boston remains expensive. That combination can generate an uncomfortable cycle: a few completed projects soften today's rents, fewer new projects pencil at today's costs, and the relief may become temporary. It's a risk, not a forecast of future rent increases.
Can we forecast Greater Boston's home additions for the next three years?
We can outline plausible paths, but publishing a precise count of 2028 completions would promise more than the available evidence supports. The latest comparable five-county observation is 15,241 net housing addresses added from July 2025 to July 2026. Across the available April 2020-July 2026 period, the annualized figure was roughly 13,820. Both are imperfect benchmarks: the extraordinary 2024-25 wave and the pandemic affect the short historical record, and the Census address file measures net changes, not a project-by-project construction schedule.
There are useful independent cross-checks. In its Boston apartment-market coverage, Moody's (opens in a new tab) projected about 3,700 multifamily deliveries in 2026, down from 6,538 in 2025, with an even smaller pipeline afterward. Matthews (opens in a new tab), citing CoStar, reported roughly 14,418 apartments under construction across its Boston market in September 2026. On November 11, Yardi Matrix (opens in a new tab) said national multifamily supply would decline in 2027 before increasing in 2028. Those sources point toward a thinner apartment pipeline, but none counts the same geography, housing types or net additions as our five-county Census measure. It would be wrong to add those numbers together or call any of them a Greater Boston total-home forecast.
So Boston Dwelling tested three illustrative July-to-July scenarios, anchored to the most recent 15,241-home annual net gain. In the middle path, we assume future annual net gains equal roughly 80%, 75% and 85% of that latest pace, rounded to the nearest 500 homes; the low and high paths deliberately test a more prolonged decline or a stronger rebound. These percentages are assumptions, not statistically estimated probabilities. The chart separates measured history from everything projected.
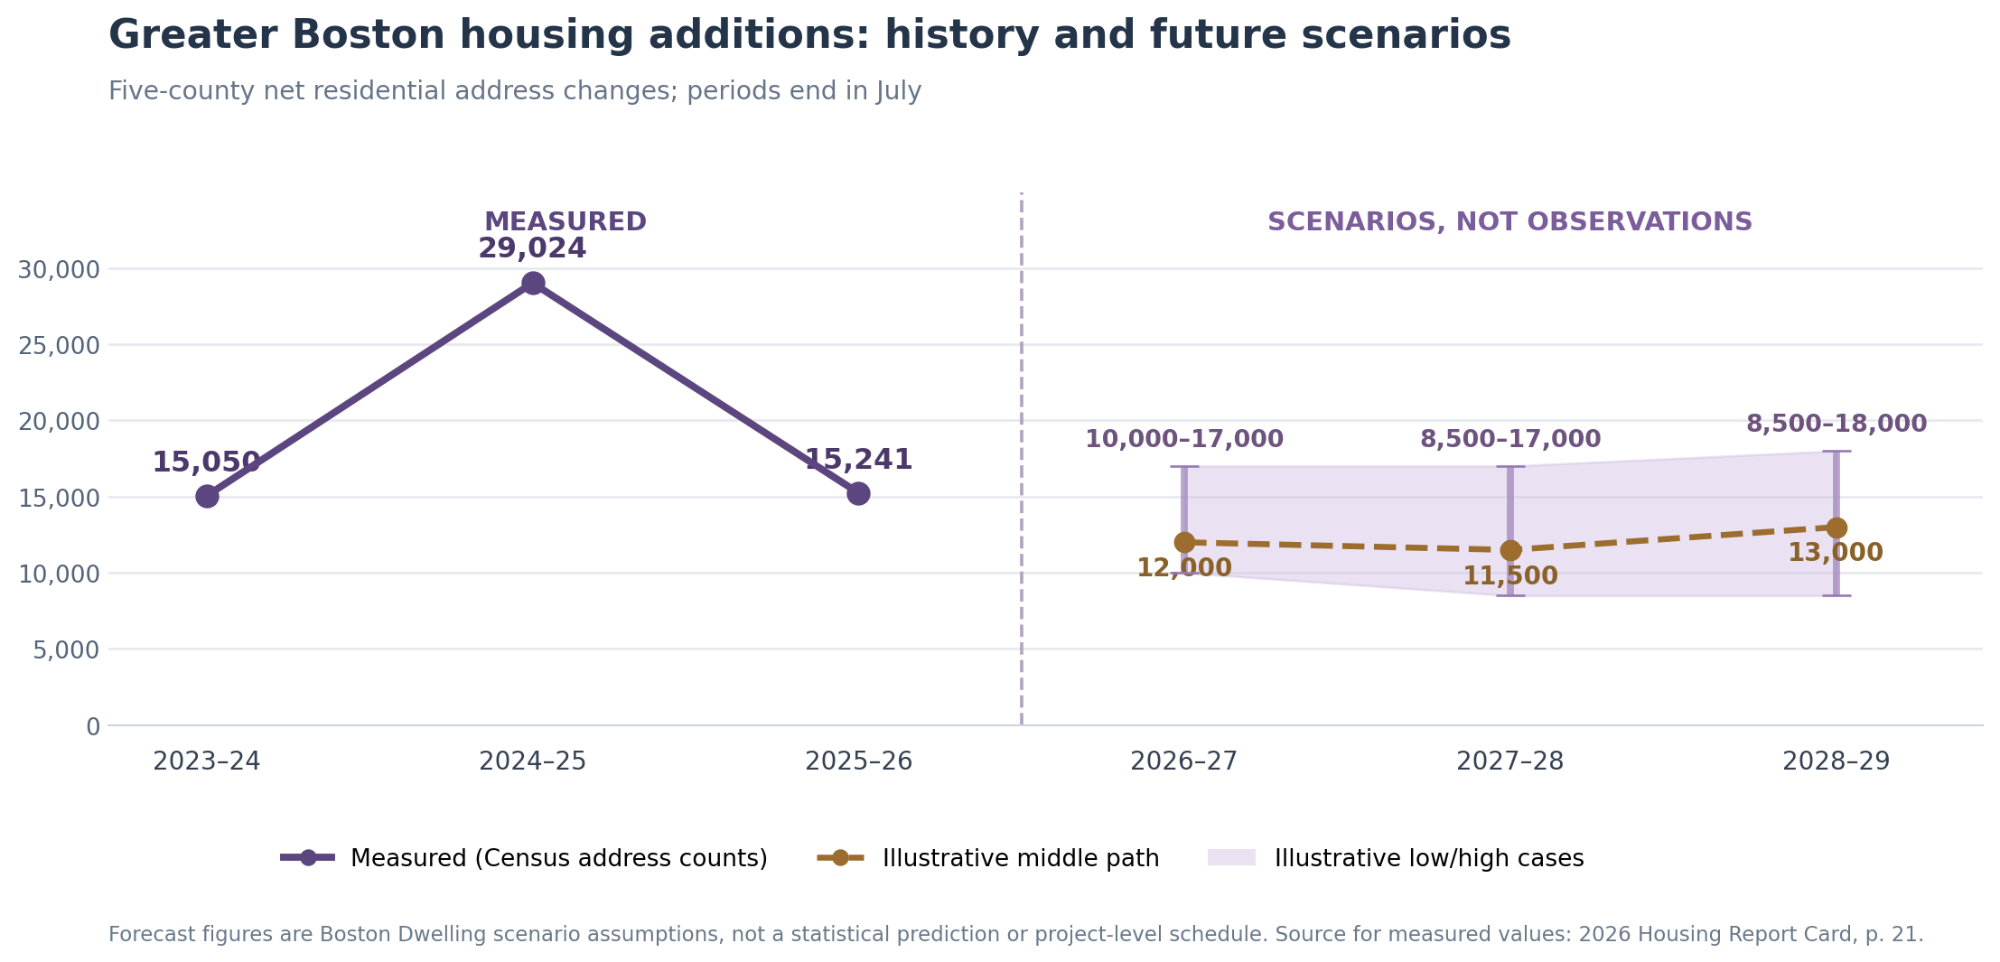
| Annual period ending | Slower-growth case | Middle path | Stronger-growth case |
|---|---|---|---|
| July 2027 | 10,000 | 12,000 | 17,000 |
| July 2028 | 8,500 | 11,500 | 17,000 |
| July 2029 | 8,500 | 13,000 | 18,000 |
Boston Dwelling hypothetical five-county July-to-July net address-change scenarios; not probabilistic forecasts or verified home completions.
Under the middle scenario, Greater Boston would add 36,500 net addresses over three years. Simply repeating the latest measured pace of 15,241 for three years would add 45,723. That is a difference of 9,223 homes, about 20% fewer, if those assumptions happen. The difference is not a verified housing shortfall, a count of cancelled projects, or a forecast that rents will rise by a certain amount.
The biggest uncertainty is when today's permitted and under-construction projects actually open, especially large buildings that may slip across calendar years. Financing, construction delays, conversions and demolitions matter too. The low and high cases are an exploratory range, not a 90% or 95% confidence interval. These scenarios should be replaced when more reliable regional project-level completion data become available.
What this means when you're apartment hunting: If relatively few new buildings open near your preferred T stop in 2027 or 2028, you may find fewer one-month-free offers competing for your lease. But another town or neighborhood could still be delivering hundreds of apartments. Check the actual openings near you rather than assuming a regional projection determines your rent.
Boston's rental vacancy rate is still less than half the national rate
If you've seen another new apartment building open near an Orange Line stop, you might reasonably wonder why rents have not fallen further. Vacancies measure the balance between the homes available and households trying to rent them. Newly delivered apartments can be filled quickly by people arriving from somewhere else, moving out of a shared apartment, or trading an older unit for a newer one.
The Census Housing Vacancy Survey (opens in a new tab) lets us compare the same rental-vacancy measure for the Boston-Cambridge-Newton metropolitan area and the United States. This is the proportion of the rental inventory that is vacant and available for rent. It is not a measure of how long apartments have sat empty, and it does not include every listing for a future move-in date. The lower panel shows a different indicator, five-county population change, to help explain demand. The boundaries do not match exactly, so these are related trends, not components of an equation.
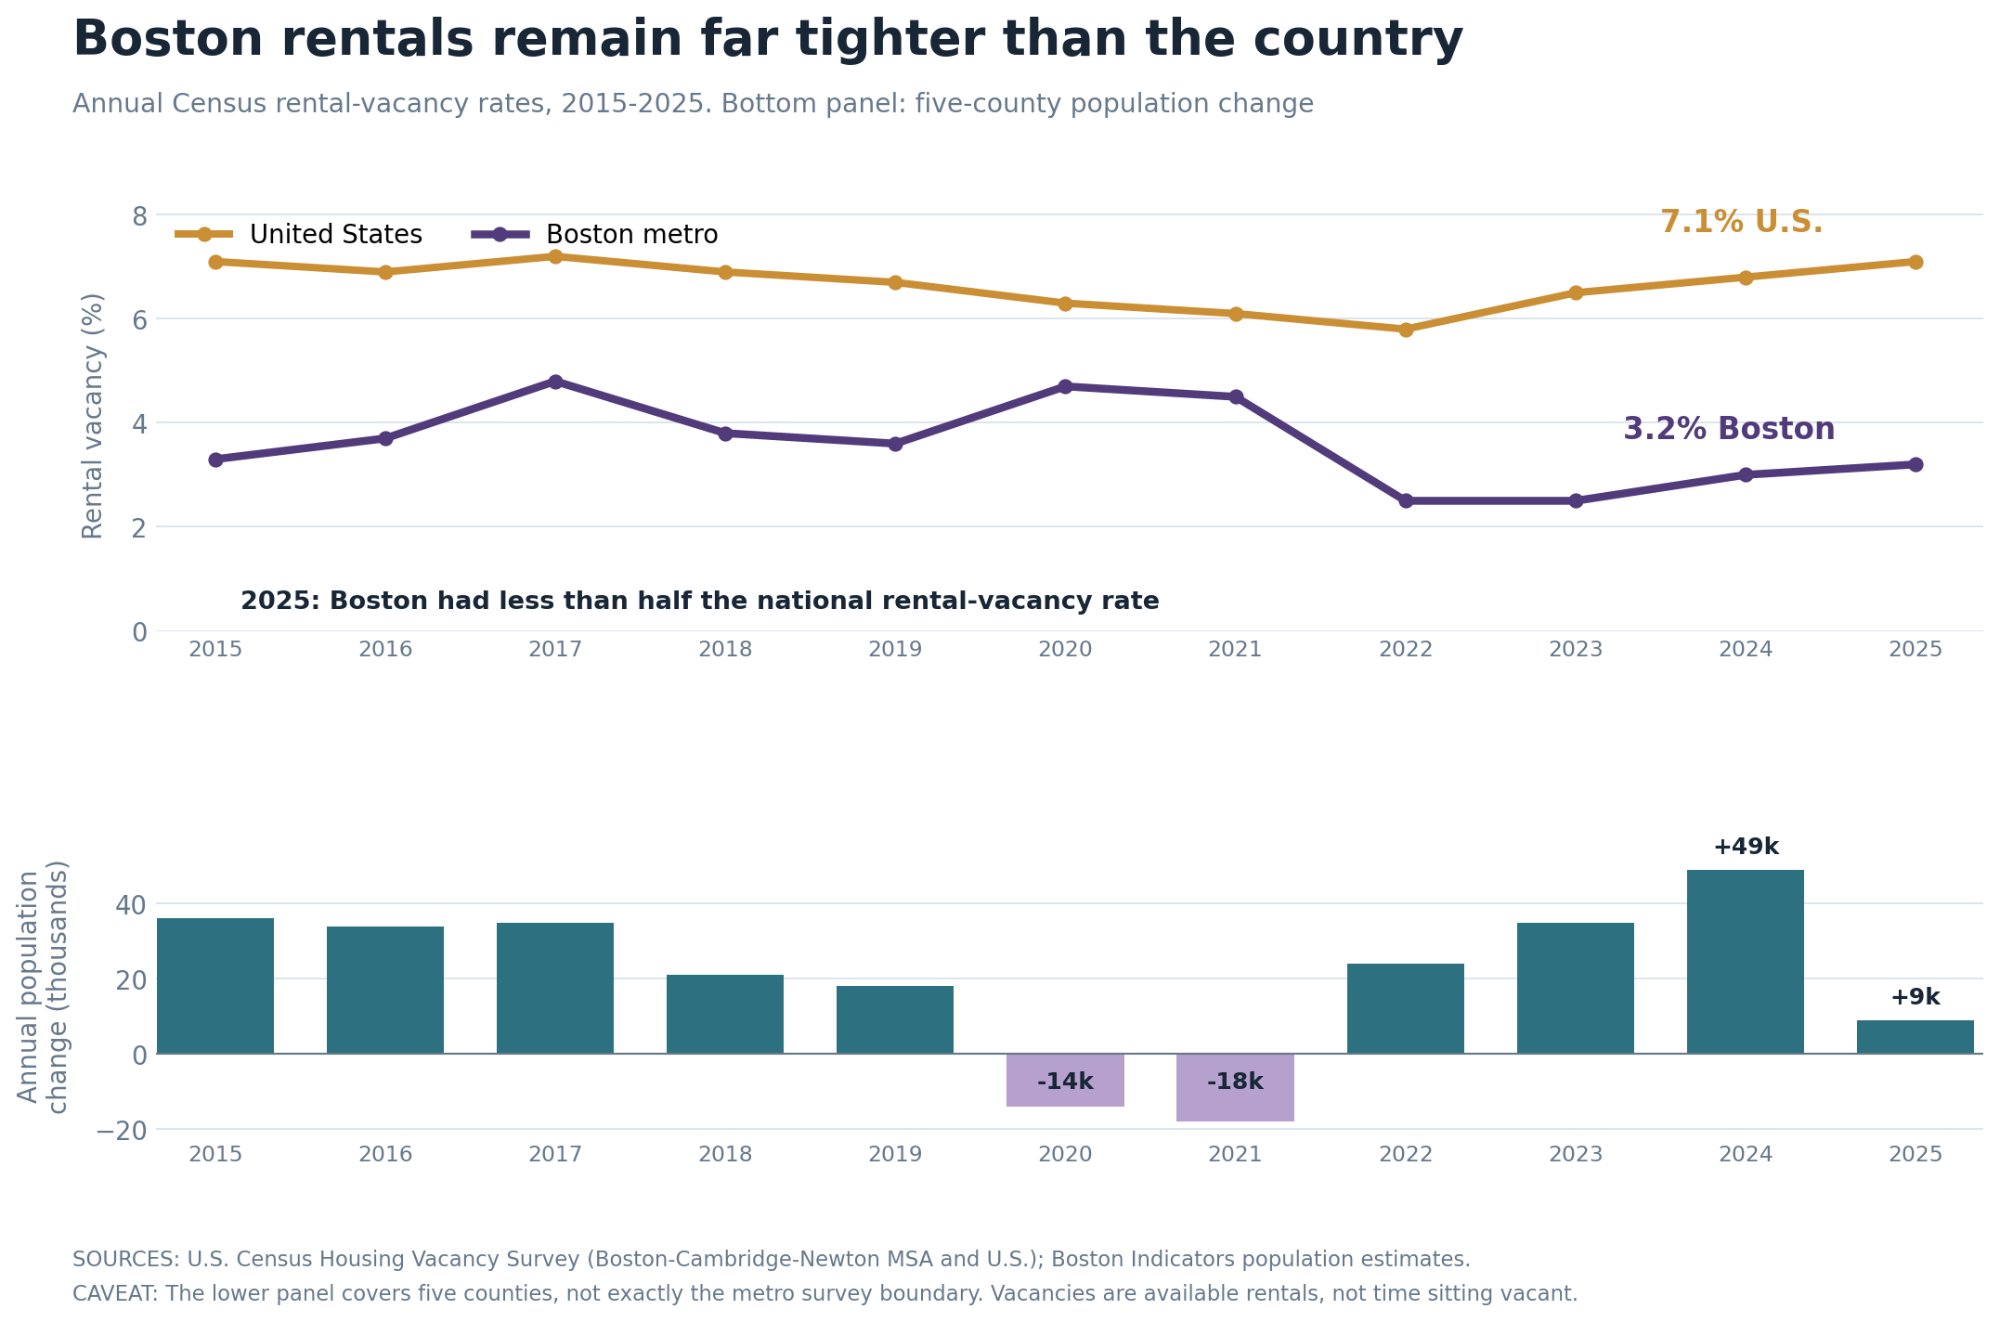
Here's the number worth remembering: In 2025, the Boston metro rental vacancy rate was 3.2%, versus 7.1% nationally. Boston's rate was 3.9 percentage points lower and just 45% of the national rate. Put simply, the share of rental housing available in Greater Boston was less than half the U.S. share, by this Census measure. That helps explain why a few prominent buildings advertising specials do not mean every apartment hunter suddenly has lots of options.
Boston's rate did rise from about 2.5% in 2022 and 2023 to 3.0% in 2024 and 3.2% in 2025. That is a real sign of some easing, not a collapse in demand. Nationally, the rate also climbed from 5.8% in 2022 to 7.1% in 2025. It is worth comparing the two full histories rather than drawing an unexplained horizontal line for what a supposedly normal Boston vacancy rate should be. All figures in this comparison are annual estimates through 2025, not an official Boston vacancy estimate for November 2026.
The lower part of the chart helps show why apartment demand can change quickly. The five-county report estimates population increases of 24,000 in 2022, 35,000 in 2023, 49,000 in 2024, then just 9,000 in 2025. It reports a loss of about 32,000 residents to domestic migration in 2025 and a slowdown in international arrivals. These are July-to-July population changes, not counts of new renter households. Household formation, employment, incomes and mortgage conditions also shape housing demand.
The economy matters here. Greater Boston lost jobs during parts of 2025 and early 2026. When people are uncertain about work, they may delay moving, find roommates or put off buying. That can make apartment leasing slower and concessions more common. But a slowdown driven partly by weaker employment is not the same thing as a healthy, abundant supply of homes.
One leading indicator: Apartment List's typical Boston-area listing took 31 days to lease in August 2026, versus 24 days in August 2022, according to the report. Those extra seven days can matter to a leasing office trying to fill a building. They do not prove your next renewal will be cheaper, particularly if you want a specific size of apartment near the T. Apartment List mainly captures professionally marketed rentals, which is only part of the region's housing stock.
The $3,074 question: does our income calculation match Boston's definition of affordable?
The report's Zillow Observed Rent Index estimated $3,074 per month for the broader Boston metropolitan market in August 2026. It's a blended, modeled rent estimate covering different apartment sizes and housing types, not the price of a standardized one-bedroom unit and not an average of all rents residents currently pay.
Here is the simple test we used in V1: $3,074 x 12 / 30% = $122,960 in annual gross household income. At $90,000 a year, the same rent alone would consume approximately 41% of gross income. Our arithmetic is correct as a rent-only, 30%-of-income benchmark. It is not the official income test for a Boston affordable apartment. And the more complete housing-cost-burden definition also includes utilities.
Boston's official approach is different. The City uses Area Median Income (AMI) schedules that vary by household size and housing program. The City's online eligibility table (opens in a new tab), updated September 28, 2026, places 100% AMI at $120,000 for one person, $137,200 for two people, and $171,400 for four. So $122,960 is approximately 102.5% of the one-person reference amount, but 89.6% of the two-person figure. That does not mean either household qualifies for a particular apartment; eligibility depends on the unit's designated income band and other restrictions.
More importantly, a fixed income-restricted rent generally is not calculated as 30% of the actual tenant's current paycheck. Programs usually take approximately 30% of an income limit assigned to a unit, often with an assumed household size based on bedrooms. Utility allowances may then reduce the amount paid directly to the landlord. Tenant-based vouchers and some income-based public-housing arrangements work differently.
For an illustrative one-bedroom unit, a commonly used calculation assumes a 1.5-person household: the midpoint of one- and two-person income limits. The City's September 2026 schedule implies these gross-rent reference ceilings, before considering property-specific rules and utility allowances:
| One-bedroom example | Maximum income reference for 1.5 persons | 30% / 12 gross-rent reference |
|---|---|---|
| 60% AMI | $77,160 | $1,929/month |
| 70% AMI | $90,020 | about $2,251/month |
| 80% AMI | $102,880 | $2,572/month |
Boston Dwelling calculations using City of Boston September 2026 income-reference schedules. These are illustrative gross-rent ceilings, not property-specific rent approvals.
These are our illustrative calculations, not a substitute for Boston's published property-specific rent schedule. The 1.5-person assumption is common in tax-credit rent schedules and corresponds to the method used in the City's historical example. Other city or federal programs may set different limits, minimum incomes, concessions or deductions. And we cannot fairly compare a one-bedroom ceiling with Zillow's blended all-unit $3,074 index as though they were matching apartments.
This distinction explains why renters sometimes see an apartment advertised as "affordable" even when its rent exceeds 30% of the actual applicant's income. The restriction is tied to a designated band, not a customized budget for every tenant. The City says income and rent limits are revised annually and are subject to change; the date a new schedule takes effect need not be January 1. Income certification and rent changes for an existing lease depend on the program and agreement.
For readers, the best questions are simple: What AMI level applies to this exact unit? How many people can occupy it? Are heat and electricity included? What utility allowance was used? Is there a minimum income requirement? And what would the rent be at renewal? A general statement that a home is "affordable" is not enough information.
The development story hiding in the numbers: why did Boston need to invest $50 million?
Now consider the other end of the housing market. In Charlestown, the next major phase of the Bunker Hill public-housing redevelopment shows what happens when a development is approved but conventional financing cannot make the project work.
The Housing Report Card describes a 266-unit building, known as Building F, with 208 market-rate homes and 58 deeply affordable homes and an estimated development cost of $176.2 million. That's roughly $662,000 in development cost per apartment, averaged across every unit and the project's full scope. Costs per home are not the same as construction cost per square foot, and averaging across mixed-income apartments does not mean the city paid $662,000 for every affordable unit.
The financing was unusual: the City put $50 million from its Housing Accelerator Fund (opens in a new tab) into public equity through the Boston Housing Authority; the housing authority took a 92.5% ownership stake; private partners contributed roughly $4.2 million; and a private lender provided a $122 million construction loan. These figures describe a financing structure, not a conventional city grant to a private landlord.
The $50 million is 28.4% of the reported development budget. It is about $188,000 per total apartment as a simple allocation, but that number should not be interpreted as a subsidy paid for each individual home. The report says the BHA targets a return of approximately 7%, below what the researchers describe as typical private-equity target returns. By accepting that lower expected return and retaining ownership and future value participation, the public entity helped close the feasibility gap. It is a real investment with risks, not free money or a guaranteed profit for taxpayers.
How normal is this? Public grants, tax credits, discounted loans, land contributions and rental vouchers are routine components of income-restricted housing finance. A $50 million public-equity position with 92.5% ownership in a single mixed-income redevelopment is not an ordinary template for every Boston apartment project.
There is useful scale context. Boston reported average City investment of approximately $98.9 million per year during 2022-2024 in the production and preservation of income-restricted housing, across several funds. In 2025, the City announced $64.2 million in recommended funding for 12 developments involving 637 units. In 2026 it announced more than $52 million for 13 developments involving 892 income-restricted rental homes. Some of those units are preserved rather than newly built, the awards involve different instruments and not all units rely solely on City money. Dividing each announcement by units would not produce comparable total subsidies per newly constructed apartment.
The City announced the $110 million Housing Accelerator Fund in November 2024 specifically to help previously approved projects stalled by financing gaps. Bunker Hill was described as its first beneficiary. That tells us the issue was serious enough to create a dedicated financing program. It does not establish how often every private development requires $50 million, how many accelerator investments have closed, or whether today's market-rate buildings generally need public ownership to pencil. We do not have a complete transaction-level sample to estimate that frequency.
For smaller private projects, zoning barriers, land costs, property taxes, high interest rates, construction wages and insurance can all affect feasibility. Some mixed-income projects receive public assistance; others do not. Some affordable buildings are financed through the Low-Income Housing Tax Credit and multiple subsidized debt sources rather than a public-equity deal. The crucial distinction is between financially difficult development, which is widespread, and a particular public-investment structure, which varies dramatically.
A development may have the right site, demand, design and zoning and still fail to raise financing. At Bunker Hill, the City responded by investing and retaining an ownership stake. Whether that model is cost-effective depends on its future returns, project performance, affordability preserved and what alternative uses of public funding would have achieved. Those are questions worth investigating, not assumptions we should answer in advance.
Why the pieces do not line up neatly
Consider the timing: a building gets financed several years ago, receives permits, then opens. During construction, the region may gain jobs and residents, raising demand. Later, demand can cool, occupancy takes longer and concessions appear. Meanwhile, fewer developers may start new buildings because financing is expensive. A low vacancy rate can persist even while new housing is arriving, especially if supply is not growing fast enough to close a deficit accumulated over decades.
That's what makes the next few years uncertain. The region's housing stock can grow and still be scarce. Rents can soften in a particular building even while a typical regionwide rent remains above $3,000. And a publicly backed mixed-income redevelopment can be financially viable under circumstances where a smaller private project is not.
The report's population, permit and vacancy indicators help explain the mechanics of that tension. They do not establish a single causal percentage for how much a specific year's permits lowered rents, how many vacant units were created by a particular project, or whether the next year will bring a housing rebound.
What changes for your next lease, home search or neighborhood?
The numbers are big. Your next decision is much smaller: whether to renew, change apartments, start looking to buy, or believe a proposed development down the street is actually coming. Here are the practical consequences.
If you rent, a weaker market can give you leverage without guaranteeing a bargain. When a larger building has several open units, ask about the base rent, free-month offers, lease length, parking and utilities, then compare the total cost over the entire lease. The national vacancy comparison is useful context, but negotiation depends on the apartments you are actually considering. An older three-decker may have no concession at all while a newly opened building nearby offers one. Also ask what rent the lease specifies for renewal, because a one-time incentive doesn't necessarily reduce your base rent next year.
If you want to buy, the listing count is only half the budget. The report's benchmark $600,000 starter home requires an estimated $181,000 in annual household income to meet its 30%-of-income carrying-cost test under specified financing assumptions. That's not the salary a lender must see for every mortgage. It does show why waiting for a few more listings may not solve the payment problem if mortgage rates, taxes and insurance remain high. Calculate your own all-in monthly payment, not just the asking price.
If you're watching development in your neighborhood, separate three events: a project won zoning or board approval; it secured the financing to start construction; it actually delivered homes. A public hearing in Somerville, a crane in Quincy and a leasing banner in Medford describe very different stages. A large housing proposal may generate headlines years before a resident can move in. Ask whether a reported number is gross proposed units, net new homes, or occupied apartments, and whether any public investment is a grant, loan or ownership stake.
If you're comparing an income-restricted apartment with a regular listing, do not assume the word “affordable” means 30% of your paycheck. Ask for that unit's AMI band, allowed household size, rent limit and utility allowance. Our $122,960 calculation is a useful rent-only household-budget benchmark for the modeled $3,074 regional rent. It is not an eligibility certificate or an official Boston maximum rent, and total housing costs can be higher after utilities.
Three findings are easy to pass along: Boston's 2025 rental vacancy rate was less than half the national rate; the latest annual net addition of 15,241 homes was almost unchanged from before the unusual 2024-25 peak; and about two years of construction time can turn today's weak permit pipeline into fewer apartments you can tour later. The $50 million Charlestown investment also shows that some mixed-income projects need a different financing model entirely. The first explains why searching can still feel competitive. The second warns against dramatic boom-and-bust headlines. The third shows how expensive the economics of delivering new, mixed-income housing have become.
One more thing for your next renewal: The building offering a special today may be leasing the last apartments from a project approved several years ago. If you expect to move in 2027 or 2028, check which communities near the T are actually under construction, not only which have been announced. That distinction is more useful than a regional forecast when you're choosing a neighborhood.
A slower Boston market is not automatically a healthier one
Greater Boston gained about 49,000 residents in 2024 but just 9,000 in 2025. Apartment listings are taking longer to rent. That can reduce competition in the short term. But a slowdown rooted partly in weakened job growth and fewer arrivals comes with real costs for the region.
Long-term relief requires enough new homes of different sizes and price points, financing structures that can deliver them, and incomes that allow residents to live here. The 2026 Housing Report Card shows signs of progress, warning signals and some promising alternatives. What it does not show is that the affordability problem has been solved. A quieter rental season is not the same thing as a market with enough housing.