Boston's Missing Middle: Why a Good Income Still Doesn't Guarantee an Affordable Home
Boston has homes for households across many income levels. But a narrow band of dedicated middle-income housing, expensive starter homes, and high construction costs leave a difficult set of choices.
By Boston Dwelling · Published · 7 min read
A couple in Boston earns $130,000 combined. They are not poor. They may even earn more than many of their friends. Yet when they look for a two-bedroom rental, think about having a child, or start saving for a condo, the choices can feel surprisingly limited. They might earn too much for one income-restricted apartment, qualify on paper for another, and still find that neither has an opening. Buying a new condo can be a different financial challenge entirely.
That is the question we want to investigate: How many middle-income households live in Boston, and how many housing options are actually being made for them? It is a different story from whether new buildings look luxurious. It is about the space between what households earn and what homes cost.
Start with a definition, not a label
There is no universal official salary that makes someone “middle class.” In housing programs, Boston uses area median income (AMI), a regional benchmark adjusted for the number of people in the household. For this article, we examine the 81%-120% AMI band, the band Boston identifies separately in its income-restricted housing inventory. This is a useful, narrow definition for studying a specific policy question, not everyone who considers themselves middle-income.
Boston's September 2026 eligibility guide sets 80%, 100% and 120% AMI income ceilings for a two-person household at $109,760, $137,200 and $164,640, respectively. That means the hypothetical $130,000 household is above an 80%-AMI maximum but under a 100%-AMI maximum. It might meet one program's income test and fail another. Actual eligibility depends on that property's restrictions, household size and other rules.
At a 30%-of-gross-income housing benchmark, $130,000 supports $3,250 per month for rent plus tenant-paid utilities. That is a calculation, not a recommendation to spend so much. Taxes, childcare, debt and savings still come out of the household budget. And $130,000 does not mean every person in the household makes six figures.
How many people are in Boston's middle-income band?
The City of Boston's most directly comparable published AMI-by-tenure analysis used 2016-2020 Census survey data, reported in 2022. It found that 14% of renter households earned 81%-120% of AMI, compared with 21% of homeowner households. Those figures combine the city's 81%-100% and 101%-120% groups. They are household percentages, not shares of Boston's individual population, and they should not be passed off as November 2026 measurements.
It would also be wrong to claim this particular band is Boston's largest income group. In that same analysis, 37% of renters earned below 30% AMI, while 24% earned above 120% AMI. The city's households are spread widely across income levels. A broader sociological definition of “middle class” would produce a different percentage.
The 2.2% statistic: what it really means
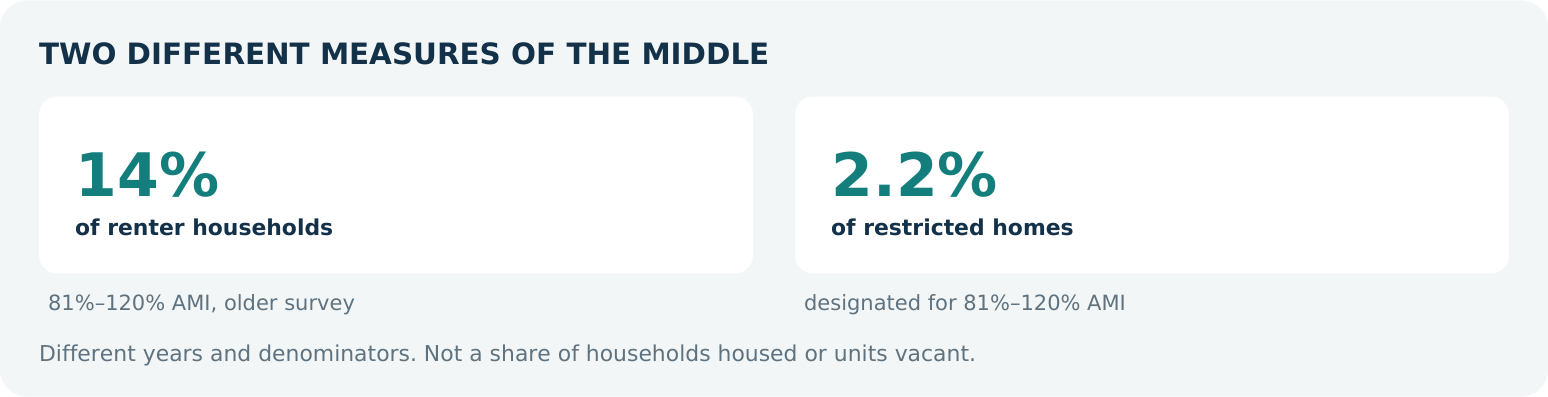
Boston's 2024 income-restricted housing inventory, published in 2025, counted 59,439 income-restricted homes citywide. Just 1,300, or 2.2% of those homes, were designated specifically for the 81%-120% AMI band. The vast majority had lower income limits, reflecting deliberate programs to serve households with the greatest need. Another 919 units were restricted above 120% AMI, and 239 had unknown designations.
The most useful comparison is straightforward: about one in seven renter households fell into this AMI band in the city's older income data, but roughly one in 46 income-restricted homes was explicitly designated for it in the later inventory.
These are different denominators and different years. The 2.2% figure is not the fraction of middle-income households that have housing, or the fraction of all homes they can afford. Most people in the band live in the unrestricted market, which includes older and sometimes relatively affordable apartments and homes. The 1,300 restricted homes are predominantly already occupied, not available listings. A household also cannot necessarily access every unit with a higher income ceiling.
Still, the mismatch in what the two measures describe reveals something important: Boston's dedicated, price-restricted middle-income stock is small relative to the presence of middle-income households. An updated, apples-to-apples citywide count of all homes affordable and available to those households is not supplied by these records. We should demand that fuller measure rather than invent a coverage percentage.
A second number that tells the story more personally: 5%

The City's own Starter Homes research found that only 5% of newly built, unrestricted two-bedroom condominiums completed in 2024 sold for $600,000 or less. In that same discussion, Boston described a roughly $125,000 median income for households headed by someone aged 25-44, and said a household at that income could potentially target a $500,000-$600,000 home under its illustrative assumptions.
Put those together: 95% of those newly completed, unrestricted two-bedroom condo sales were above $600,000. This is a narrow, meaningful slice of the market, not every condo sale, resale, neighborhood or unit size. But it helps explain why the “starter home” feels so elusive, even to people earning a solid household income.
There is a different reality for existing, less expensive condos or homes shared by roommates. This article is not claiming that all middle-income Bostonians are locked out of all housing. It is showing why the market for new family-suitable ownership homes can be especially difficult.
Why doesn't someone just build cheaper new homes?
A developer cannot eliminate land, foundations, plumbing, code compliance, interest expense or labor costs by leaving out a rooftop pool. New construction still has to pay for those items, and rents or sale proceeds have to cover the project's financing and operating requirements. A different unit mix, less parking, efficient plans, cheaper land, faster approvals or public support can improve the numbers, but none guarantees feasibility at a particular site.
Research from the Federal Reserve Bank of Boston estimated that construction costs in its Boston project analysis had risen about 40% since 2020. Separately, Massachusetts reported that state-funded new affordable housing construction exceeded $650,000 per home in total development costs in 2024. These are different types of cost evidence; neither is the price tag of a typical private-market Boston apartment. Both help explain why below-market rents often require subsidy, lower land costs or a different financial structure.
One practical tool is MassHousing's Workforce Housing program, which supports deed-restricted units affordable to households below 120% AMI, with up to $100,000 of subsidy per eligible workforce home. Boston's inclusionary housing rules also create income-restricted apartments within qualifying developments, although the exact mix of income limits matters. A program ceiling is not evidence that a particular unit is available or that an application is open.
Is anyone trying to build for this group?
Yes. Boston's NUBA Homes proposal in Nubian Square is a useful concrete example: a city project tracker describes 45 planned income-restricted ownership homes, including 16 below 80% AMI, 16 below 100% AMI and 13 below 120% AMI, led by Urbanica. But the tracker shows no verified construction completion date. These are planned homes, not 45 listings ready for buyers.
The example also shows why “middle-income housing” cannot be reduced to one number. Homes targeted below 80% AMI serve a different group than homes permitted up to 120%. Bedroom sizes, sales prices, mortgage requirements, deed restrictions and opening dates matter just as much as unit counts.
What readers can actually do
If you're looking to rent or buy, first calculate your household's income and size and check the specific income bands for listings on Boston's Metrolist. Do not assume that earning too much for one program rules you out of every income-restricted home. Then compare the complete monthly cost of an unrestricted home, not just its advertised price or base rent.
If a development is announced on your street, ask four questions: How many homes? At which AMI limits? What are the actual rents or sale prices? Are they proposed, under construction, complete, or accepting applications? A percentage in a press release is not the same thing as a home someone can occupy.
Finally, follow the development records and neighborhood reporting rather than just the ribbon-cutting photographs. Boston Dwelling will continue examining these income bands and tracking actual housing openings, with a focus on what households can afford, not marketing descriptions. If you have a project or a question about the gap between your income and available homes, email hello@bostondwelling.com. We can look into it in future reporting.
The takeaway: Boston has built and preserved significant housing for lower-income households, and that need remains urgent. But its dedicated 81%-120% AMI housing stock is small, and newly built starter-home prices can still be far above what many middle-income households can manage. The challenge is not a slogan about luxury. It is creating and clearly measuring real housing choices for people in the middle, without neglecting those with the greatest need.