Does Renting in Boston Get Cheaper in Winter? Nine Years of Data Show the Catch
Winter discounts are real. But a two-year cost comparison, nearly two years of weekly listings and local renter reporting reveal when they actually pay off.
In this article
Imagine you are choosing between renewing the apartment you already know and finding a new place this January. Boston's September 1 moving rush has faded, and listings are advertising free rent. Does waiting for winter really save you money, or could you end up paying more for a smaller selection?
The short answer: the seasonal price trend is real, but it is not a universal January discount. In a November 2026 analysis, Apartment List found Boston's estimated new-lease rents fell from October to November in all nine years from 2017 through 2025. The typical decline was 2.10%, versus 0.52% nationally. Meanwhile, Boston Pads' marketed availability rose sharply in spring 2026 and retreated toward November, leaving fewer advertised options than at the peak.
That is why two renters can have entirely different experiences in the same winter. Someone flexible on location and move-in date may find a discount. Someone who needs a particular two-bedroom, transit stop, pet policy or parking arrangement may have fewer workable choices. Here is what the data tell us, and what they do not.
Nine years of Boston rent data show a real autumn pattern
Apartment List studied month-to-month changes in its estimated median rent for newly signed leases across all bedroom sizes. From 2017 through 2025, the typical Boston October-to-November change was a 2.10% decline, and all nine observations moved downward. The corresponding national change was a 0.52% decline, with eight of nine years falling. This is a consistent historical pattern, not a guarantee about a specific unit.
What does 2.10% look like in dollars? On an illustrative $2,500 monthly rent, it amounts to $52.50 per month, or $630 across a 12-month lease. That calculation applies a historical market percentage to a hypothetical rent. It is not an observed discount on the same apartment and should not be treated as a forecast for this winter.
There's current evidence of the same seasonal direction. Apartment List's November 2026 report puts Boston's October median at $2,453, down 1.6% during October, compared with a national drop of just 0.3%. Somerville's October median was $2,670, down 1.4%. Yet Boston's median was still 1.6% higher than a year earlier. Rents can be falling month to month and rising year over year at the same time (Boston report; Somerville report).
The real catch: choice shrinks after spring, but 2026 is different from 2025
Boston Pads' Greater Boston rental availability rate measures units advertised for either immediate or future move-in through its listing network; it is not the share of apartments sitting vacant today. The detailed weekly table shows 3.06% on January 5, a spring high of 7.03% on April 27, and 3.51% on November 8, 2026. That's a 50.1% decline in the rate since the spring peak, although the number of usable apartments for an immediate move is a separate question.
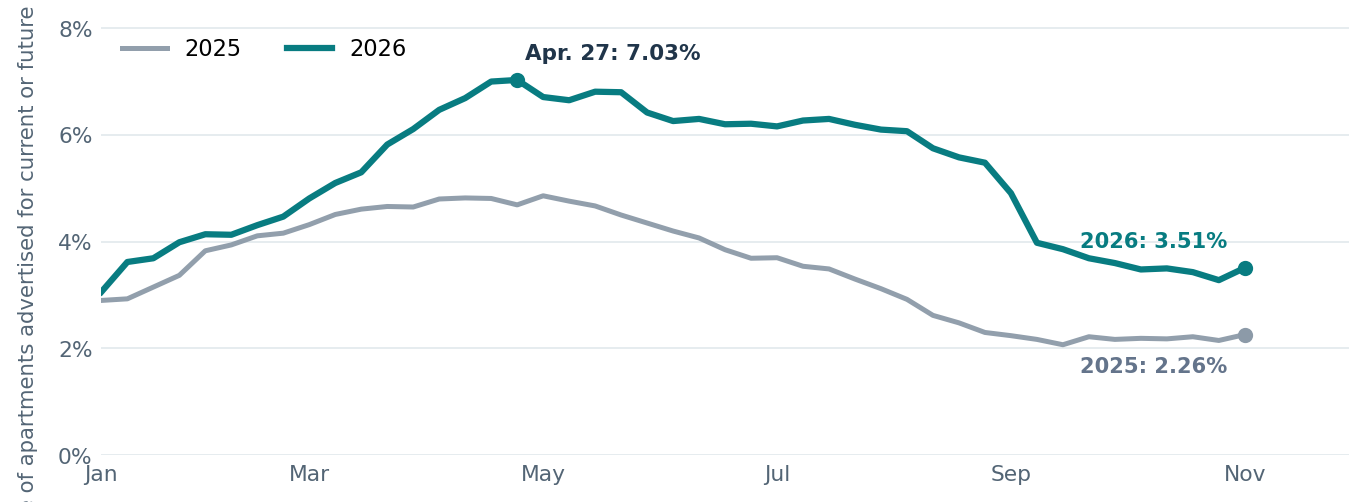
But spring listings are often for September 1, not for an April move. The best month to shop for a September lease therefore differs from the best month to start a new lease. This chart puts the complete available January-to-early-November weekly observations from 2025 and 2026 side by side, instead of joining a handful of widely spaced data points.
A second surprise: November 2026 was not as thin as the prior November in this listing network. The November 8, 2026 availability rate was 3.51%, versus 2.26% on November 10, 2025, a roughly 55% higher advertised-availability rate at a comparable point in the year. That suggests more marketed choice than last fall, even though there was less than at the spring 2026 high. This is a platform-reported rate, not a census of total vacant apartments.
Boston's academic-calendar cycle helps explain the mismatch. Student-heavy areas such as Allston, Brighton, Fenway and Mission Hill concentrate turnover around September, and landlords often start marketing those homes in late winter or spring. Boston.com traced the history and debated causes of the Sept. 1 tradition in 2025; weather and academic schedules both matter.
Why some winter listings are more negotiable
For a landlord, an empty apartment generates no rental income while carrying costs continue. In interviews published by the Boston Globe in January 2024, Centre Realty Group's Adam Taffel and Boston Pads' Demetrios Salpoglou discussed the cost of maintaining vacant units in freezing weather, including heating and the risk of property problems. These were interviews conducted by the Globe, not Boston Dwelling.
That helps explain why an apartment still vacant after its advertised September start date can become a negotiation opportunity. A landlord might consider a lower base rent, a move-in credit or a different start date to reduce the vacancy period. But an apartment can also sit empty because its layout, condition, location or asking price is unappealing. A discounted listing is not automatically a good deal.
In a fall 2026 listing audit, Brookline brokerage Metro Realty compared apartments with past-due advertised move-in dates against upcoming rentals in the same neighborhood and bedroom category. In 17 of 20 comparisons, the past-due group had a lower median and average asking price; the report described a typical asking-price gap of about 12.6%. A South End one-bedroom comparison was $3,419 versus $4,073. Those were different listed apartments, not matched leases, and some listings may have been stale. The gap cannot be called a 12.6% winter discount.
The trend has a human example, too. NBC10 Boston interviewed Brookline renter Graham Lent in August 2026. He said the landlord was worried about the apartment remaining unrented, so he received a free month's rent. Mission Hill renter Jacob Tamkin told the station he had seen similar one- and two-month specials. These are previously published local interviews, not interviews conducted by Boston Dwelling, and neither experience is proof that everyone can negotiate that deal.
Why credible Boston rental reports sometimes seem to disagree
Here is a revealing contradiction: Apartment List's historical citywide rent estimates show a consistent autumn decline. Yet Metro Realty's analysis of Boston Pads data found that Boston's average asking rent increased about 2.1% from late September to late December 2025. Both statements can be accurately reported without either proving that winter offers a discount on a specific apartment.
They measure different things. Apartment List models the estimated market median for new leases using Census benchmarks and repeat listing transactions. Boston Pads tracks average asking rents across listings in its network, where the mix of properties changes over time. The geographic definitions and exact date windows differ, too. A winter market with fewer lower-priced apartments left on the platform can show a higher asking average even when comparable units become more negotiable. The sources do not isolate that as the cause of the 2025 divergence; it is an illustration of why renters should examine the metric before accepting a headline.
| Measure | What it tells you | What it cannot tell you |
|---|---|---|
| New-lease rent index | How estimated rents changed in the broader market | The quote for your chosen apartment on a chosen start date |
| Active-listing asking average | What the changing set of advertised apartments costs | The signed rent or a same-unit seasonal discount |
| Availability rate | Share marketed now or for a future start date | How many match your move-in date, size, budget and preferences |
Illustrative comparison; definitions and sources are provided in Sources and methodology.
For a more local asking-rent cross-check, Spot Easy's November 2026 data desk reported that the average one-bedroom listing across 10 Greater Boston cities fell $58 from September to October 2026 to $2,724, while two-bedroom asking rent fell $61 to $3,373. This describes active licensed-agent listings, not executed leases or the same apartments quoted twice.
A large managed building and a three-decker can behave differently
In a professionally managed apartment building with many units, a quote may change with the floor plan, lease length and start date. Management may offer rent credits instead of reducing the contractual base rent. Apartment List's January 2026 research also found that large operators have been spreading lease expirations more evenly across the year.
A smaller landlord renting one floor of a Somerville or Dorchester three-decker may have a single vacant unit and a preferred annual lease calendar. There may be room to discuss timing or price after a vacancy, but the owner may also wait for a tenant who fits the original term. Neither outcome is guaranteed. In student-centered neighborhoods, your winter search may uncover mostly September-start listings rather than immediately available winter apartments.
Almost half of properties advertised major concessions. Here is the catch.
Apartment List's Boston tracker reported that 46.4% of properties on its platform advertised discounts worth at least one month of rent in October 2026, up from 29.0% in May. That's 17.4 percentage points higher, or about 1.6 times the earlier share. Crucially, a qualifying concession need not literally be one month free; it could be a different discount of equivalent value. The measure is property-level offers in the platform's coverage, not the share of every Boston rental unit receiving free rent. This pattern alone does not prove the increase was caused by winter.
There are concrete local examples. An indexed November 2026 Avalon North Station leasing page advertised up to two months free on select studio and three-bedroom homes and one month on select one- and two-bedrooms, subject to eligibility and lease-term conditions. At 75 Willow Court in Dorchester, the leasing FAQ advertises two months free for qualifying starts by January 1, 2027, on leases extending through May 28, 2028 or later; it explains that the full base rent remains on the lease and that credits may be used in month two and month six or spread out. These are dated advertised offers, not guaranteed concessions for every apartment, and terms can change.
A key distinction: a landlord may advertise a reduced net-effective rent while the legally stated base rent stays higher. A renewal may be quoted from that base once the credit expires. A renter comparing a $3,000 ordinary lease with a $3,200 lease offering a free month should compare both the total first-term cost and the cost of the next term.
A surprising two-year comparison: the free month can lose
Consider two illustrative options for the same 24-month housing horizon, assuming a second 12-month lease is offered at unchanged base rent. Option A costs $3,200 per month with one free month during the first 12 months, then $3,200 with no concession in year two. Option B costs $3,000 every month with no special. In year one, A costs $35,200 versus B's $36,000. The advertised free month wins by $800. But over 24 months, A totals $73,600 and B totals $72,000, so the seemingly generous special costs $1,600 more. Neither option has a base-rent increase in this illustration.
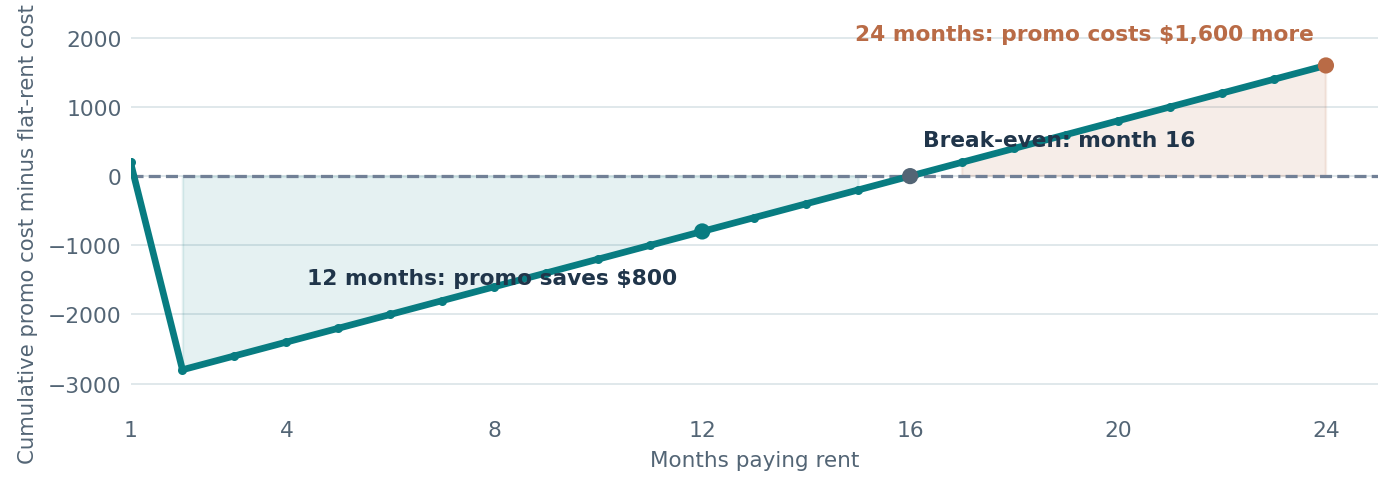
The chart shows the running difference between the two options, not actual offers or forecast rents. By month 16 their cumulative costs tie; by month 24, the higher base rent has overtaken the upfront credit. If the household leaves after the first year, Option A is cheaper, but anyone comparing offers should consider both the expected length of stay and the lease's renewal terms.
| Illustrative offer | Year 1 total | Year 2 total | 24-month total |
|---|---|---|---|
| $3,200 base, 1 free month in year 1 | $35,200 | $38,400 | $73,600 |
| $3,000 base, no free rent | $36,000 | $36,000 | $72,000 |
| Difference: promo minus flat rent | -$800 | +$2,400 | +$1,600 |
Illustrative comparison; definitions and sources are provided in Sources and methodology.
One free month of $3,200 rent is worth $3,200 over the first 12 months, equivalent to about $267 per month across that one lease. That does not automatically beat a lower base rent. It is also worth asking how parking, pet charges, internet, utilities and mandatory fees affect the full cost, because a headline special rarely discounts all of them.
The math: moving date, overlap and real savings
These are constructed arithmetic examples, not actual Boston quotations. If waiting one month produces an extra $700 in temporary housing and storage costs but lowers the following 12 months of rent by $50, the rent reduction totals $600 and the delay costs $100 more overall. If your current and new leases overlap, compare the full calendar-period cash outlay rather than counting the old rent twice. The right move-in date is the one with the lowest all-in cost and acceptable housing choice, not merely the lowest advertised monthly number.
Two practical winter-moving checks that are easy to miss
Winter tours can reveal drafts, weak heating and window problems hidden in a summer showing. Massachusetts's current sanitary code generally requires temperatures of at least 68 F between 7 a.m. and 11 p.m. and 64 F overnight during the heating season, subject to permitted local date adjustments. Ask whether heat is included, what bills typically look like, and how maintenance requests are handled.
Also plan the logistics. In Boston, a moving-truck street permit does not override snow-emergency parking restrictions. The city says approved permit signs must be posted at least 48 hours in advance. Before treating a cheaper winter lease as savings, price the moving company, parking, possible weather delays and any overlap with your existing lease.
So when should a Boston renter actually shop?
| Your situation | Timing to investigate | Why |
|---|---|---|
| Need broad selection for Sept. 1 | Start monitoring in winter; tour in late winter/spring | Many Sept. units appear before summer; choice matters more than off-season discounts |
| Flexible on apartment and move date | Compare October through February quotes | Fewer competing renters may make aged or vacant units negotiable |
| Need a specific floor plan or school location | Search whenever a suitable unit appears | Scarcity of that exact unit may outweigh typical seasonal savings |
| Already have an acceptable renewal offer | Compare total stay-versus-move economics | Moving fees, time and overlap may erase a modest rent decrease |
Illustrative comparison; definitions and sources are provided in Sources and methodology.
For an apartment search starting now, ask a property to quote the same unit for more than one commencement date and the same term length. Check recently changed prices and how long it has been advertised. Ask whether any concession applies only to certain dates, and request the total monthly charges after utilities, parking and mandatory fees. If you are using a broker, understand who retained that agent and exactly what you would owe. For a separate guide to Massachusetts move-in charges, see Boston Dwelling's move-in fees explainer (opens in a new tab).
What the evidence actually says
Boston's historical rent index shows a repeated autumn decline, but that is only half the story. The 2026 weekly listing data show fewer advertised options than the spring peak but more than the comparable week of 2025. And property-level concessions may make an apartment cheaper for one lease without lowering its base rent. For Boston renters, the best time is not a month on the calendar. It is when a real apartment, real lease dates and total costs all work in your favor.