What it takes to build six homes near Magoun Square
At 128 Central Street in Somerville, what would it cost to replace one house with six homes, and what would buyers or renters pay?
In this article
BOSTON DWELLING / PROPERTY POTENTIAL
Boston Dwelling independently selected 128 Central Street, a Somerville site offered for sale at $1.7 million. This hypothetical study is our own. We have no affiliation with the owner, listing broker or development team.
Six homes near two Green Line stops
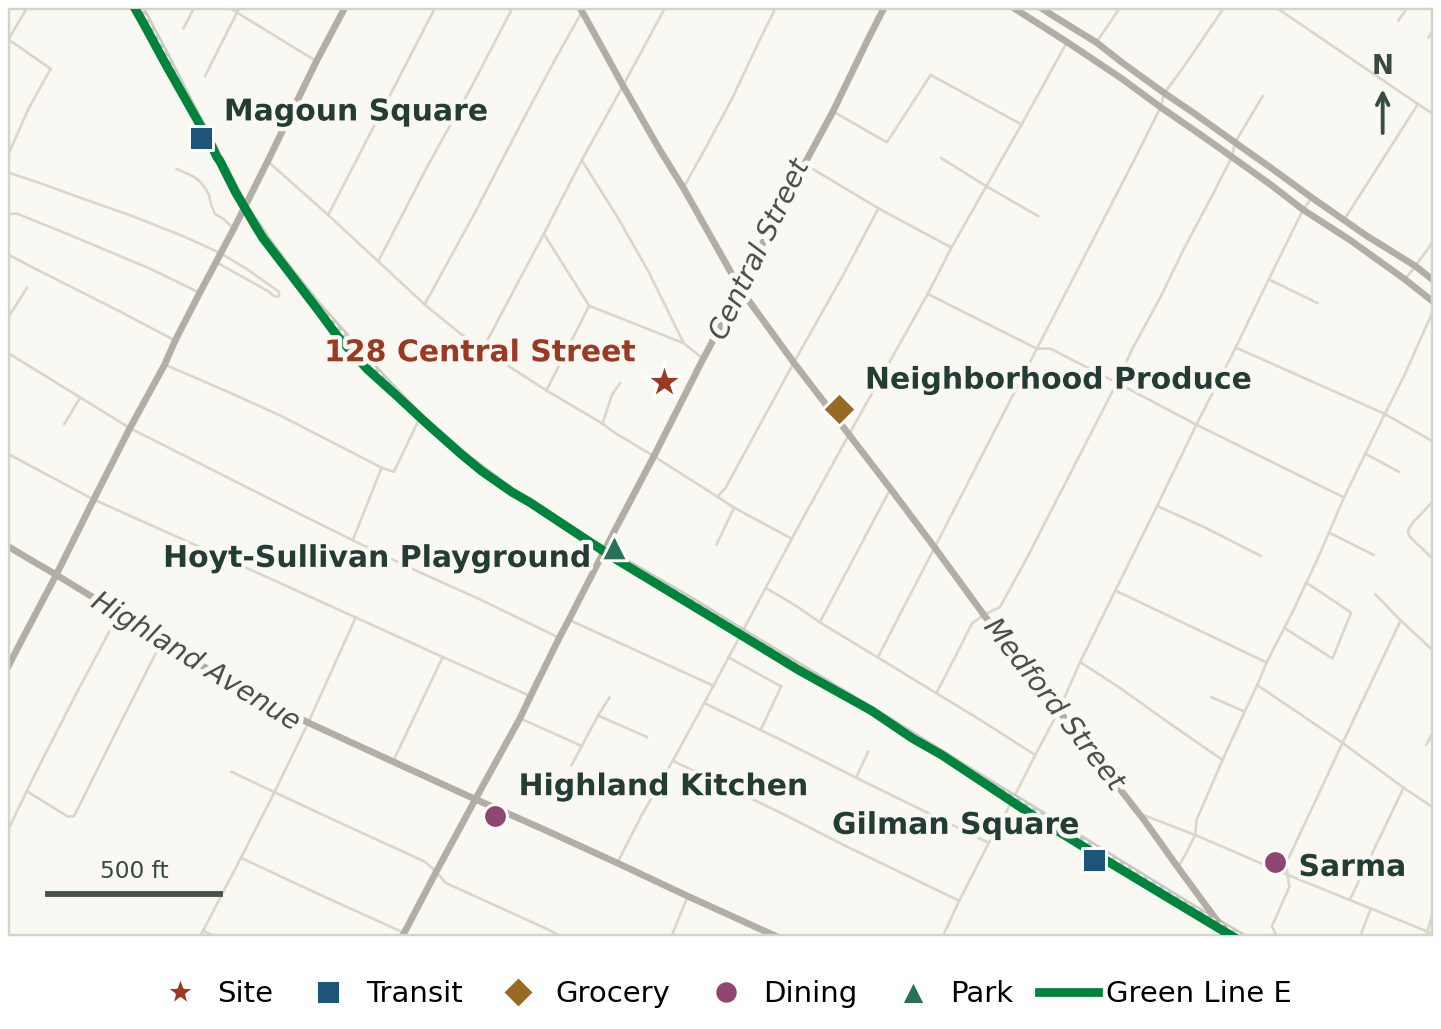
At 128 Central Street, the everyday attractions are modest and close together. There is Neighborhood Produce for groceries, Hoyt-Sullivan Playground for an afternoon outside, and Highland Kitchen for dinner. The Community Path connects the neighborhood to the Green Line. Gilman and Magoun Square stations are each roughly a ten-minute walk. A household that wants a second bedroom and can get by with one car has good reason to look here. Our design includes four parking spaces for six homes, so two households would need to go without an on-site space if each of the other four took one.
How strong is local demand for apartments?
In the year covered by CoStar’s November report, the number of occupied apartments in its Somerville/Charlestown sample rose by 592, while developers delivered 282 units. Occupied units grew by 310 more than deliveries, a sign that households also filled existing vacancies. The sample of 7,727 apartments was 96.2% occupied. Rent growth tells a less comfortable story for a landlord. Asking rents rose 3.3%, but effective rents, after concessions, rose just 0.7%.
Neighboring Cambridge recorded 4.1% vacancy and 3.6% annual rent growth in the third quarter, according to Colliers. Together, those figures explain why we would test rents here. Actual condo sales tell us more about what buyers will pay on this block. Colliers market report (opens in a new tab)
Which apartment projects are under construction?
CoStar lists four projects in its Somerville/Charlestown apartment sample. Two entries account for 2,957 of 2,991 homes, nearly 99%. The other two are small Somerville sites. The table covers a rental-market sample across two communities, so it cannot tell us how many small condo projects are under construction.
| Project | CoStar units | What the public record shows |
|---|---|---|
| Bunker Hill, Charlestown | 2,669 | The housing authority describes 2,699 homes over a decade, including replacements. Construction began on Building F, which will have 266 homes, including 208 market-rate apartments. |
| 299 Broadway, Winter Hill | 288 | The developer reports 319 rentals across two buildings, 136 affordable and 183 market-rate. Construction has started. |
| 2-4 Alpine Street, Somerville | 26 | The city issued a full construction permit for 26 homes and a ground-floor commercial space. |
| 16 Moreland Street, Somerville | 8 | The city issued foundation permits for two three-family homes and two cottages. This is the closest example in scale and layout. |
CoStar lists four projects in its Somerville/Charlestown apartment sample.
Bunker Hill’s entry appears to group most of the master plan into one delivery year. CoStar’s 2027 forecast assumes 2,669 deliveries and 11.9% vacancy. We’d test that vacancy as a downside. For leasing at Central Street, 299 Broadway is the one to watch. CoStar’s estimated June 2028 opening overlaps our modeled delivery window. Bunker Hill groundbreaking (opens in a new tab) · 299 Broadway developer update (opens in a new tab) · Alpine permit (opens in a new tab) · Moreland permits (opens in a new tab)
There is evidence that financing a start is difficult. At 299 Broadway, the affordable building used state and federal tax credits, and Somerville approved tax increment financing. A ground lease and construction loan supported the other building. Moreland shows that smaller sites can advance, too. Permits reveal what someone is building. They disclose little about what the owner paid for the land or what return the project will earn.
What can fit on Central Street?
Somerville documented a circa-1880 single-family house and issued a demolition permit. A separate application for new construction, B26-000522, describes three homes on each side of a semi-detached building. The city lists it as under review. We could not confirm demolition on site. The offering describes 5,990 square feet of land. Replacing the house with six homes would add five homes to the site. City preservation review (opens in a new tab) · City demolition permit (opens in a new tab) · City building application (opens in a new tab)
The site maps to Neighborhood Residence (NR). We test a pair of attached three-family homes, one per legal building lot. The semi-detached form has a 2½-story limit and dimensions up to 28 by 48 feet per side. Four 980-square-foot two-bedrooms and two 1,320-square-foot three-bedrooms would yield 6,560 private square feet in 8,000 gross. That target depends on the amount of usable lower-level space. A survey and measured drawings must establish two buildable lots, frontage, setbacks, usable area, daylight, egress, outdoor space and parking access. Six is the proposal on file. The achievable yield still depends on how the two lots and buildings fit. City zoning map (opens in a new tab) · Residential standards (opens in a new tab)
Would one home have to be affordable? The planning director explained that NR permits up to four homes by right on a qualifying lot with no district affordability requirement. Our two-lot, three-per-lot concept therefore assumes six unrestricted homes, including under rental ownership. Recorded restrictions, a subsidy agreement or a different permit path could change that answer. Before valuing the land, confirm title and zoning with the city and price drainage, utilities, tree protection, fire separation, accessibility and specialized energy-code compliance. Council action (opens in a new tab) · Zoning Board minutes (opens in a new tab) · State energy-code map (opens in a new tab)
From acquisition to the last closing
Allow three months for final design and approvals, 15 for building and four to close six sales. An unresolved lot or permit issue would extend that schedule. Equity and construction draws pay contractors. Condo proceeds arrive at closing, when selling expenses and a portion of the loan are paid. We assume no buyer deposits fund construction.
| Budget at the $1.7m land price | Amount | What it covers |
|---|---|---|
| Land and acquisition closing | $1,750,000 | $1.7m land plus $50,000 closing allowance |
| Vertical construction | $2,600,000 | 8,000 gross sq ft at $325 per foot |
| Construction contingency | $208,000 | 8% of vertical cost |
| Design, permits, legal and soft costs | $520,000 | 20% of vertical cost |
| Development fee | $100,000 | Sponsor compensation, expensed |
| Demolition, abatement and site work | $180,000 | $60,000 removal and abatement, $120,000 utilities and excavation |
| Parking, carry and marketing | $200,000 | Four spaces at $25,000 each, plus $100,000 for carry and marketing |
| Cost before borrowing | $5,558,000 | Site-specific trade bids outstanding |
| Interest and loan fee through sellout | $228,600 | $163,350 through construction, $41,250 during closings, $24,000 fee |
| Cost before condo selling expenses | $5,786,600 | Selling expenses add 4% of the actual sale prices |
Budget at the $1.7 million land price.
Could the build get cheaper? Somerville’s 2025 feasibility study used $293 per gross square foot for stick construction and $250 in an ownership scenario. Our $325 adds roughly 11% to $293 for a small, constrained project. Boston’s broad RLB construction benchmark rose 5.87% in the year to Q3 2024, 4.18% to Q3 2025 and 4.45% to Q3 2026. ENR’s June Boston building-cost index rose only 0.4%. Neither measures a six-home bid. Dropping from $325 to $293 would save $256,000, a nearly 10% cut. A builder could price repeated layouts, stacked utilities and simpler foundations against the same plans. We would require a comparable written bid to count those savings. City feasibility study (opens in a new tab) · Historical Boston cost series (opens in a new tab) · Q3 city breakdown (opens in a new tab) · ENR Boston indices (opens in a new tab)
How expensive is 8.25%? A November rate sheet put community-bank construction loans at 8.00% to 8.25% and regional banks at 7.15% to 7.75%. Two years earlier, NAHB’s national builder survey averaged 8.54% on speculative single-family construction and 8.11% on presold homes. The 2024 survey covers different projects, but it shows construction money was already expensive. On our $2.4 million line, every percentage point saved is $24,800 over the modeled draw and sellout. Even a 6.25% loan saves just $49,600. Actual leverage, fees, guarantees and release prices require a lender term sheet. Current rate sheet (opens in a new tab) · NAHB historical survey (opens in a new tab)
What would a buyer choose instead?
For a two-bedroom, the strongest evidence is within walking distance of Magoun Square. At the new 28-home Warwick, unit 401, a two-bedroom penthouse, closed for $940,000 in November. Another two-bedroom, unit 302, was marketed at $934,900 with one year of condo fees paid. Floor level, balconies and garage parking help explain differences in price. Some Warwick homes are income-restricted and belong outside a market-rate comparison. At Central Street we would test $800,000 for 980 square feet, or $816 per private square foot. Our upside of $860,000 has a credible local precedent, especially for an upper unit with parking. Warwick sales and inventory (opens in a new tab) · Unit 302 terms (opens in a new tab) · City affordable offerings (opens in a new tab)
For a three-bedroom, the buyer has more leverage. At 53 Trull Street near Magoun Square, a newly built three-bedroom with 3½ baths and 1,600 square feet asked $995,000, or $622 per foot. The listing also advertises special financing. Central Street’s base asks buyers to pay $1.05 million for 1,320 square feet, or $795 per foot. The nearby 41A Sargent sale reached $1.04 million for 1,806 square feet. An additional bedroom below grade, or a home without parking, would make our premium harder to earn. What Trull actually closes for is more informative than another month of regional vacancy data. Trull listing and history (opens in a new tab) · Sargent closed sale (opens in a new tab)
How the land price changes the outcome
At four sales of $800,000 and two of $1.05 million, buyers would pay $5.30 million. After 4% selling expenses, the project collects $5.088 million. The chart holds land at $1.7 million and changes the build bid and sale prices. The contingency and soft-cost allowances stay fixed in dollars throughout the sensitivity.
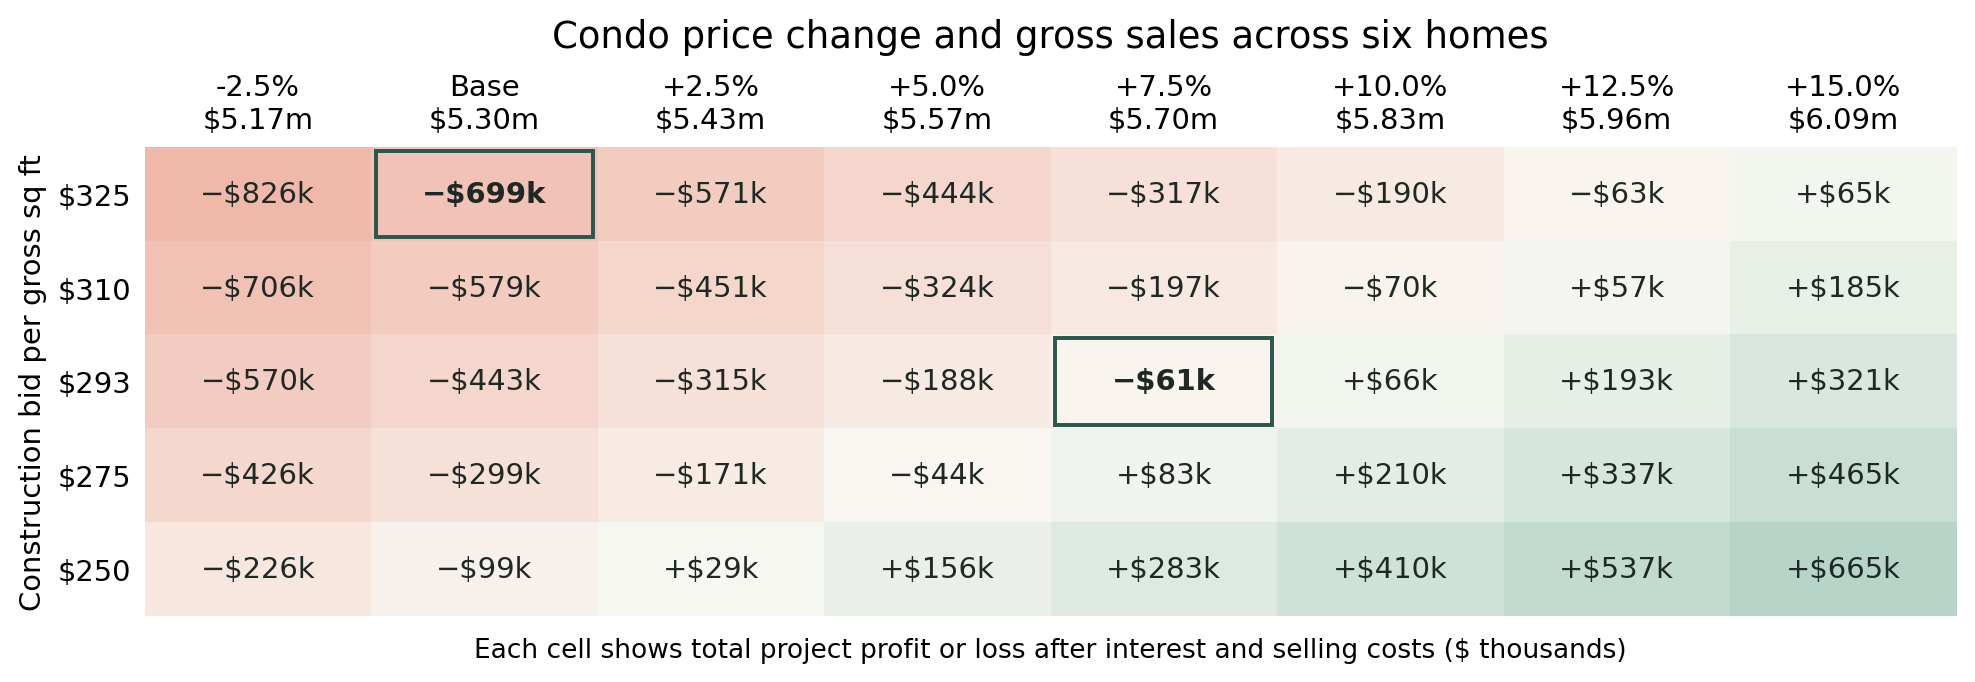
Read one square. At $293 per gross square foot and 7.5% higher prices, all six sales still leave a $61,000 loss at the $1.7 million land price. Buying the land for $900,000 improves that same outcome by $800,000. A seller willing to share in future profit could reduce the cash paid upfront, but the value of the seller’s share still counts toward the land cost.
What could the six rented apartments sell for together?
A landlord buys the income from six leases. A two-bedroom at 515 Medford (opens in a new tab) previously asked $3,700. A Magoun/Ball Square two-bedroom with two baths was advertised at $3,999. Three-bedroom asks ranged from $3,600 at 238 School to $4,800 at renovated 139 Sycamore. We use $3,650 and $4,150 by bedroom count, and would test $4,000 and $4,600 on the best finished units. Achieving the higher rents across all six would require signed leases, including for the least desirable layouts. 515 Medford · Magoun two-bedroom (opens in a new tab) · 238 School (opens in a new tab) · 139 Sycamore (opens in a new tab)
Which whole-building sales deserve the most weight?
| Sale and distance from site | Price / units | What transfers to Central Street |
|---|---|---|
| 38 Berkeley St, Spring Hill · 0.4 mi · Sep 2026 | $2.425m / 6 | $480 per reported living sq ft. Closest location and a recent six-unit sale near Gilman. Built in 1928, with two studios and four two-bedrooms. CoStar reports a 6.5% cap. |
| 6-8 Rush St, East Somerville · 0.9 mi · Dec 2021 | $3.95m / 6 | $607 gross, $693 rentable. Closest bedroom mix, with five two-beds and one three-bed. Renovated in 2018, six parking spaces and half occupied at sale. |
| 235 Charles St, Cambridge · 1.8 mi · Jul 2024 | $4.10m / 6 | $448 gross, $574 living. Kendall-area job access and more large units make this a secondary comparison. |
| 16 Church St, Dorchester · 6.1 mi · Sep 2026 | $1.925m / 3 | $390 per MLS-listed sq ft. Built in 2024, with three roughly 1,079-sq-ft three-bedrooms. Useful for newer construction only. |
| 185 E St, South Boston · 4.7 mi · Nov 2026 | $5.125m / 4 | $652 per MLS-listed sq ft on 7,858 sq ft. New luxury homes, substantially larger on average, in a different buyer market. |
Distances are approximate straight-line miles.
Berkeley and Rush carry the most weight. Berkeley tells us what an investor recently paid near the same Green Line stop. Rush tells us what six similar apartments fetched in another part of Somerville, five years earlier. Neither sale establishes a new-building premium on Central Street. The Boston sales illustrate the wide spread for new construction across neighborhoods. We use local rents and buyer yields to price our building. Distances are approximate straight-line miles. Berkeley closing (opens in a new tab) · Rush appraisal (opens in a new tab) · Cambridge sale broker (opens in a new tab) · Church closing (opens in a new tab) · E Street closing (opens in a new tab)
| Stabilized sale scenario | 2BR / 3BR monthly rent | Cap rate | Gross sale | Per gross / private sq ft |
|---|---|---|---|---|
| Base | $3,650 / $4,150 | 5.75% | $2.80m | $350 / $427 |
| Higher rents, same yield | $4,000 / $4,600 | 5.75% | $3.09m | $386 / $471 |
| Higher rents, stronger buyer bid | $4,000 / $4,600 | 5.25% | $3.34m | $417 / $508 |
| Outer upside | $4,350 / $4,800 | 4.80% | $3.85m | $482 / $587 |
Rental values shown are gross, before an assumed 2% selling cost.
How high could a buyer go? About $3.34 million is an upside case we would test. $3.85 million pairs the submarket’s approximate two-bedroom ask with the top local three-bedroom ask and CoStar’s low modeled submarket cap. At our 5.75% yield, matching Rush’s $3.95 million would require rent averaging $5,334 per home per month. Applying Rush’s $607 per gross square foot to our 8,000 gross square feet suggests $4.85 million. At base rents, that price implies only a 2.9% return after reserves and modeled tax. We would need evidence of a buyer willing to accept that return or pay for another use before relying on it.
Leasing risk, public funding and the decision to start
At base rents, all six homes generate $274,800 a year before vacancy. We allow 5% for vacancy and collection loss, 23% of scheduled rent for operating expenses other than real estate taxes, $6,000 for reserves and about $31,000 for taxes. That leaves $161,000 a year after reserves. A 5.75% exit cap falls between CoStar’s modeled 4.8% submarket rate and its reported 6.5% on both Berkeley and Walnut. At the blended rent, one or two move-ins at each month-end would leave about $80,000 or $46,000, respectively, of rent unearned during initial lease-up. CoStar’s 5.8% asking-to-effective rent gap, applied at base rents with expenses held fixed, would take stabilized value from $2.80 million to $2.58 million.
A six-home opening has little room for error. One vacancy is one-sixth of the building. At Assembly Row, the 500-home Miscela was 55.8% leased the December after opening and 87.2% the following June. A market study reports full occupancy in six to seven months at Dorchester’s 36-home Meeting House. Those examples explain our choice to allow several months for lease-up. Neither gives a six-unit Somerville project an observed stabilization date. Miscela annual filing (opens in a new tab) · June update (opens in a new tab) · Meeting House study (opens in a new tab)
Could a partner or subsidy close the gap? At 163 Glen Street, Somerville Community Corporation and a private co-developer combined a bank loan with city Community Preservation Act funding. Eight of eleven condos became permanently affordable. We found no automatic grant or tax discount for six unrestricted homes at Central Street. Massachusetts HDIP targets Gateway Cities, and MassHousing’s CommonWealth Builder guidelines generally require at least ten restricted homes. A nonprofit partnership would need its own restricted prices and a funding commitment. Two $250,000 price reductions alone would cost $480,000 in proceeds after selling fees. We assume zero public subsidy. Glen Street developer account (opens in a new tab) · State HDIP (opens in a new tab) · MassHousing guidelines (opens in a new tab)
What would justify breaking ground?
We would pursue a purchase option and a builder’s bid now. We would pass on buying the land for $1.7 million. The base condos lose $699,000 after financing and selling costs, an 11.6% loss on total cost and a negative 17.1% annualized equity IRR. The rental alternative earns a stabilized 2.9% on its $5.56 million cost before financing. Even the $3.85 million outer-upside rental sale falls about $1.7 million short of that cost before lease-up and sale expenses.
A condo deal could work at a different land price. With land at $900,000, a bid of $293 per gross square foot for the same work and sale prices 7.5% above base, estimated profit is $739,000, a 14.9% return on cost and 26.6% annualized equity IRR over 22 months. That case requires about $1.13 million for each three-bedroom. Hold our two-bedrooms at $860,000 and cap the threes at Trull’s $995,000 ask, and profit falls to $482,000, or 9.7% on cost. At those prices, the land could support about $674,000 for an illustrative 15% project return. At base sale prices, that land limit falls to $566,000.
The first dollars should answer three questions. Can an architect fit the six homes at the assumed sizes, including the lower floors? Will a builder commit to the full scope and put equity alongside ours on agreed terms? Can closed sales or credible presales support the two least valuable homes after concessions? Revisit the site when the answers and the seller’s price agree. Strong occupancy gives us a reason to do that work now. Taking construction risk requires a price that still works if the three-bedrooms disappoint.
Sources and underwriting notes
Verification date. November 21, 2026. Independent hypothetical analysis by Boston Dwelling. The site plan, costs, rents, capital structure, cap rates and schedule are our estimates. The study uses a historical acquisition benchmark and assumes no later increase in condo prices unless labeled. Linked city, developer, broker and MLS sources accompany the relevant passages.
Market coverage. CoStar, Somerville/Charlestown Multi-Family Submarket Report, November 21, 2026, pp. 2-3, 7-10, 17, 19 and 21. CoStar, Somerville/Charlestown Multi-Family Capital Markets Report, same date, pp. 2-3 and 12. Their inventory is a tracked sample of rental properties. Cambridge’s figures come from Colliers’ separate geography. The CoStar table and the Housing Authority’s Bunker Hill plan use different unit counts. Each is attributed in the text. No licensed report pages or images are reproduced.
Rental sale method. The building has 8,000 gross square feet, including 6,560 square feet of private living space. Stabilized value equals scheduled annual rent, less vacancy, operating expenses, reserves and property tax, divided by the buyer’s required yield. Tax is modeled at $10.98 per $1,000 of estimated value, so it is recalculated at each price. Broker cap-rate conventions can differ on reserves. Capitalizing income before the $6,000 reserve instead would add roughly $88,000 in the base case. Rental values shown are gross, before an assumed 2% selling cost. The 5.25% upside yield assumes a buyer pays a premium for new construction. It is an estimate. Somerville assessor (opens in a new tab)
Condo returns. Net profit deducts land, all listed development costs, the sponsor fee, interest through closings and selling expenses. Profit on cost divides that result by total cost, including selling costs. A 15% return on cost is our illustrative development hurdle, before income tax. Equity IRR annualizes all monthly investor contributions and receipts before any partner split. A condo sellout pays capital back at closings, so recurring cash-on-cash yield would tell readers little. The rental yield on cost measures income before borrowing.
Debt and timing. Assume $240,000 of debt at acquisition, another $120,000 drawn evenly each month for 18 months, 8.25% interest on the average balance and a 1% fee on $2.4 million. Spread non-land development costs evenly over those 18 months. In months 19-22, close one, two, two and one homes, respectively, repaying $400,000 of principal per home at month-end. The first and last closings are two-bedrooms. In each of the middle months, one two-bedroom and one three-bedroom close. Peak modeled equity is $3.35 million at base and $2.29 million under the lower-cost plan. A six-month delay at full draw adds $99,000 in interest before other carry. Actual lender terms may change the timing of distributions.
Investment approach. Local absorption tests demand. Competing homes test what makes this product worth buying. The land price, downside sale case, builder’s scope and marginal cost of debt determine whether risk earns a return. These tests adapt the investment research behind this series. Sam Zell on demand (opens in a new tab) · Oaktree on investment risk (opens in a new tab) · Jon Gray on real estate (opens in a new tab) · Brookfield on operations (opens in a new tab) · Starwood on financing (opens in a new tab) · Hines research (opens in a new tab)
Figure credits. Map and financial chart by Boston Dwelling, November 2026. Street names, centerlines and rail geometry from U.S. Census TIGERweb (opens in a new tab). Site pin from the city permit record, Green Line E route and station points from the MBTA, and amenities from Census address geocoding. Sale distances are rounded straight-line measurements between geocoded addresses. The station walking estimates use OpenStreetMap pedestrian routes and vary by entrance. Chart shows whole-project profit after financing and selling costs, before tax. Census TIGERweb · MBTA route geometry (opens in a new tab) · Routing (opens in a new tab) · © OpenStreetMap contributors (opens in a new tab)