Why can it be so hard to rent in some Boston suburbs?
A town can fit your life and still offer few homes you can rent. The housing mix helps explain why.
By Boston Dwelling · Published · Updated · 7 min read
Maybe you want to live closer to work in Waltham, stay near family in Lexington, or try a quieter neighborhood before deciding whether to buy. Renting should let you make that move without committing to a mortgage. But a town can fit your life and still offer very few homes you can actually rent.
That is a different problem from an apartment being too expensive. Before comparing the rent, you need a home that exists in the right place, has enough bedrooms and is accepting a new tenant. Greater Boston has built those choices very unevenly. Understanding the pattern can help you search more deliberately, and judge whether a local housing proposal would add an option your community is missing.
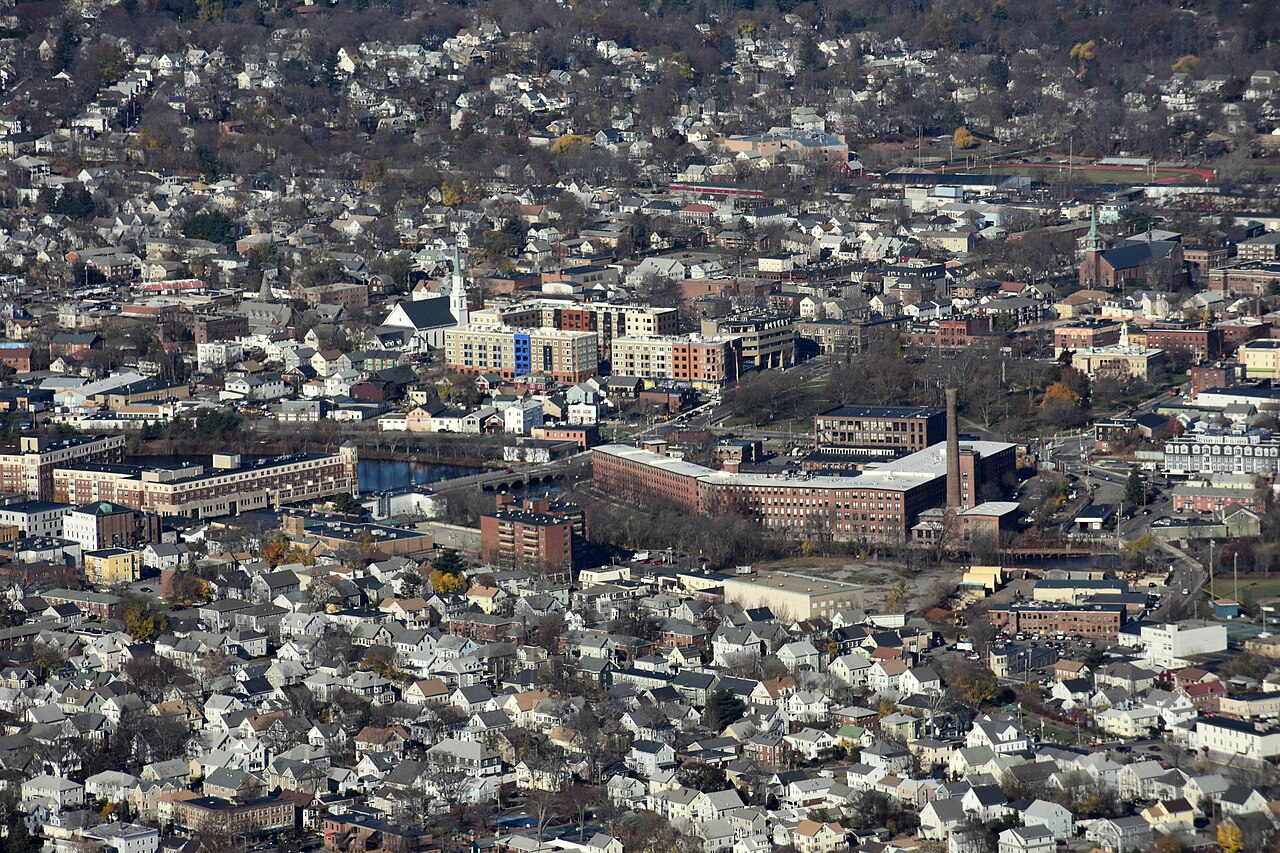
Central Waltham around the Charles River and Moody Street bridge, photographed November 21, 2015. Historical neighborhood context; no current rent, vacancy or building-tenure claim is made for a pictured property. Photo: Nick Allen · Source: Wikimedia Commons · CC BY-SA 4.0 · Wikimedia thumbnail resized proportionally from the original; no crop or scene edits.; preview thumbnails may be cropped
How much of the neighborhood is open to renters?
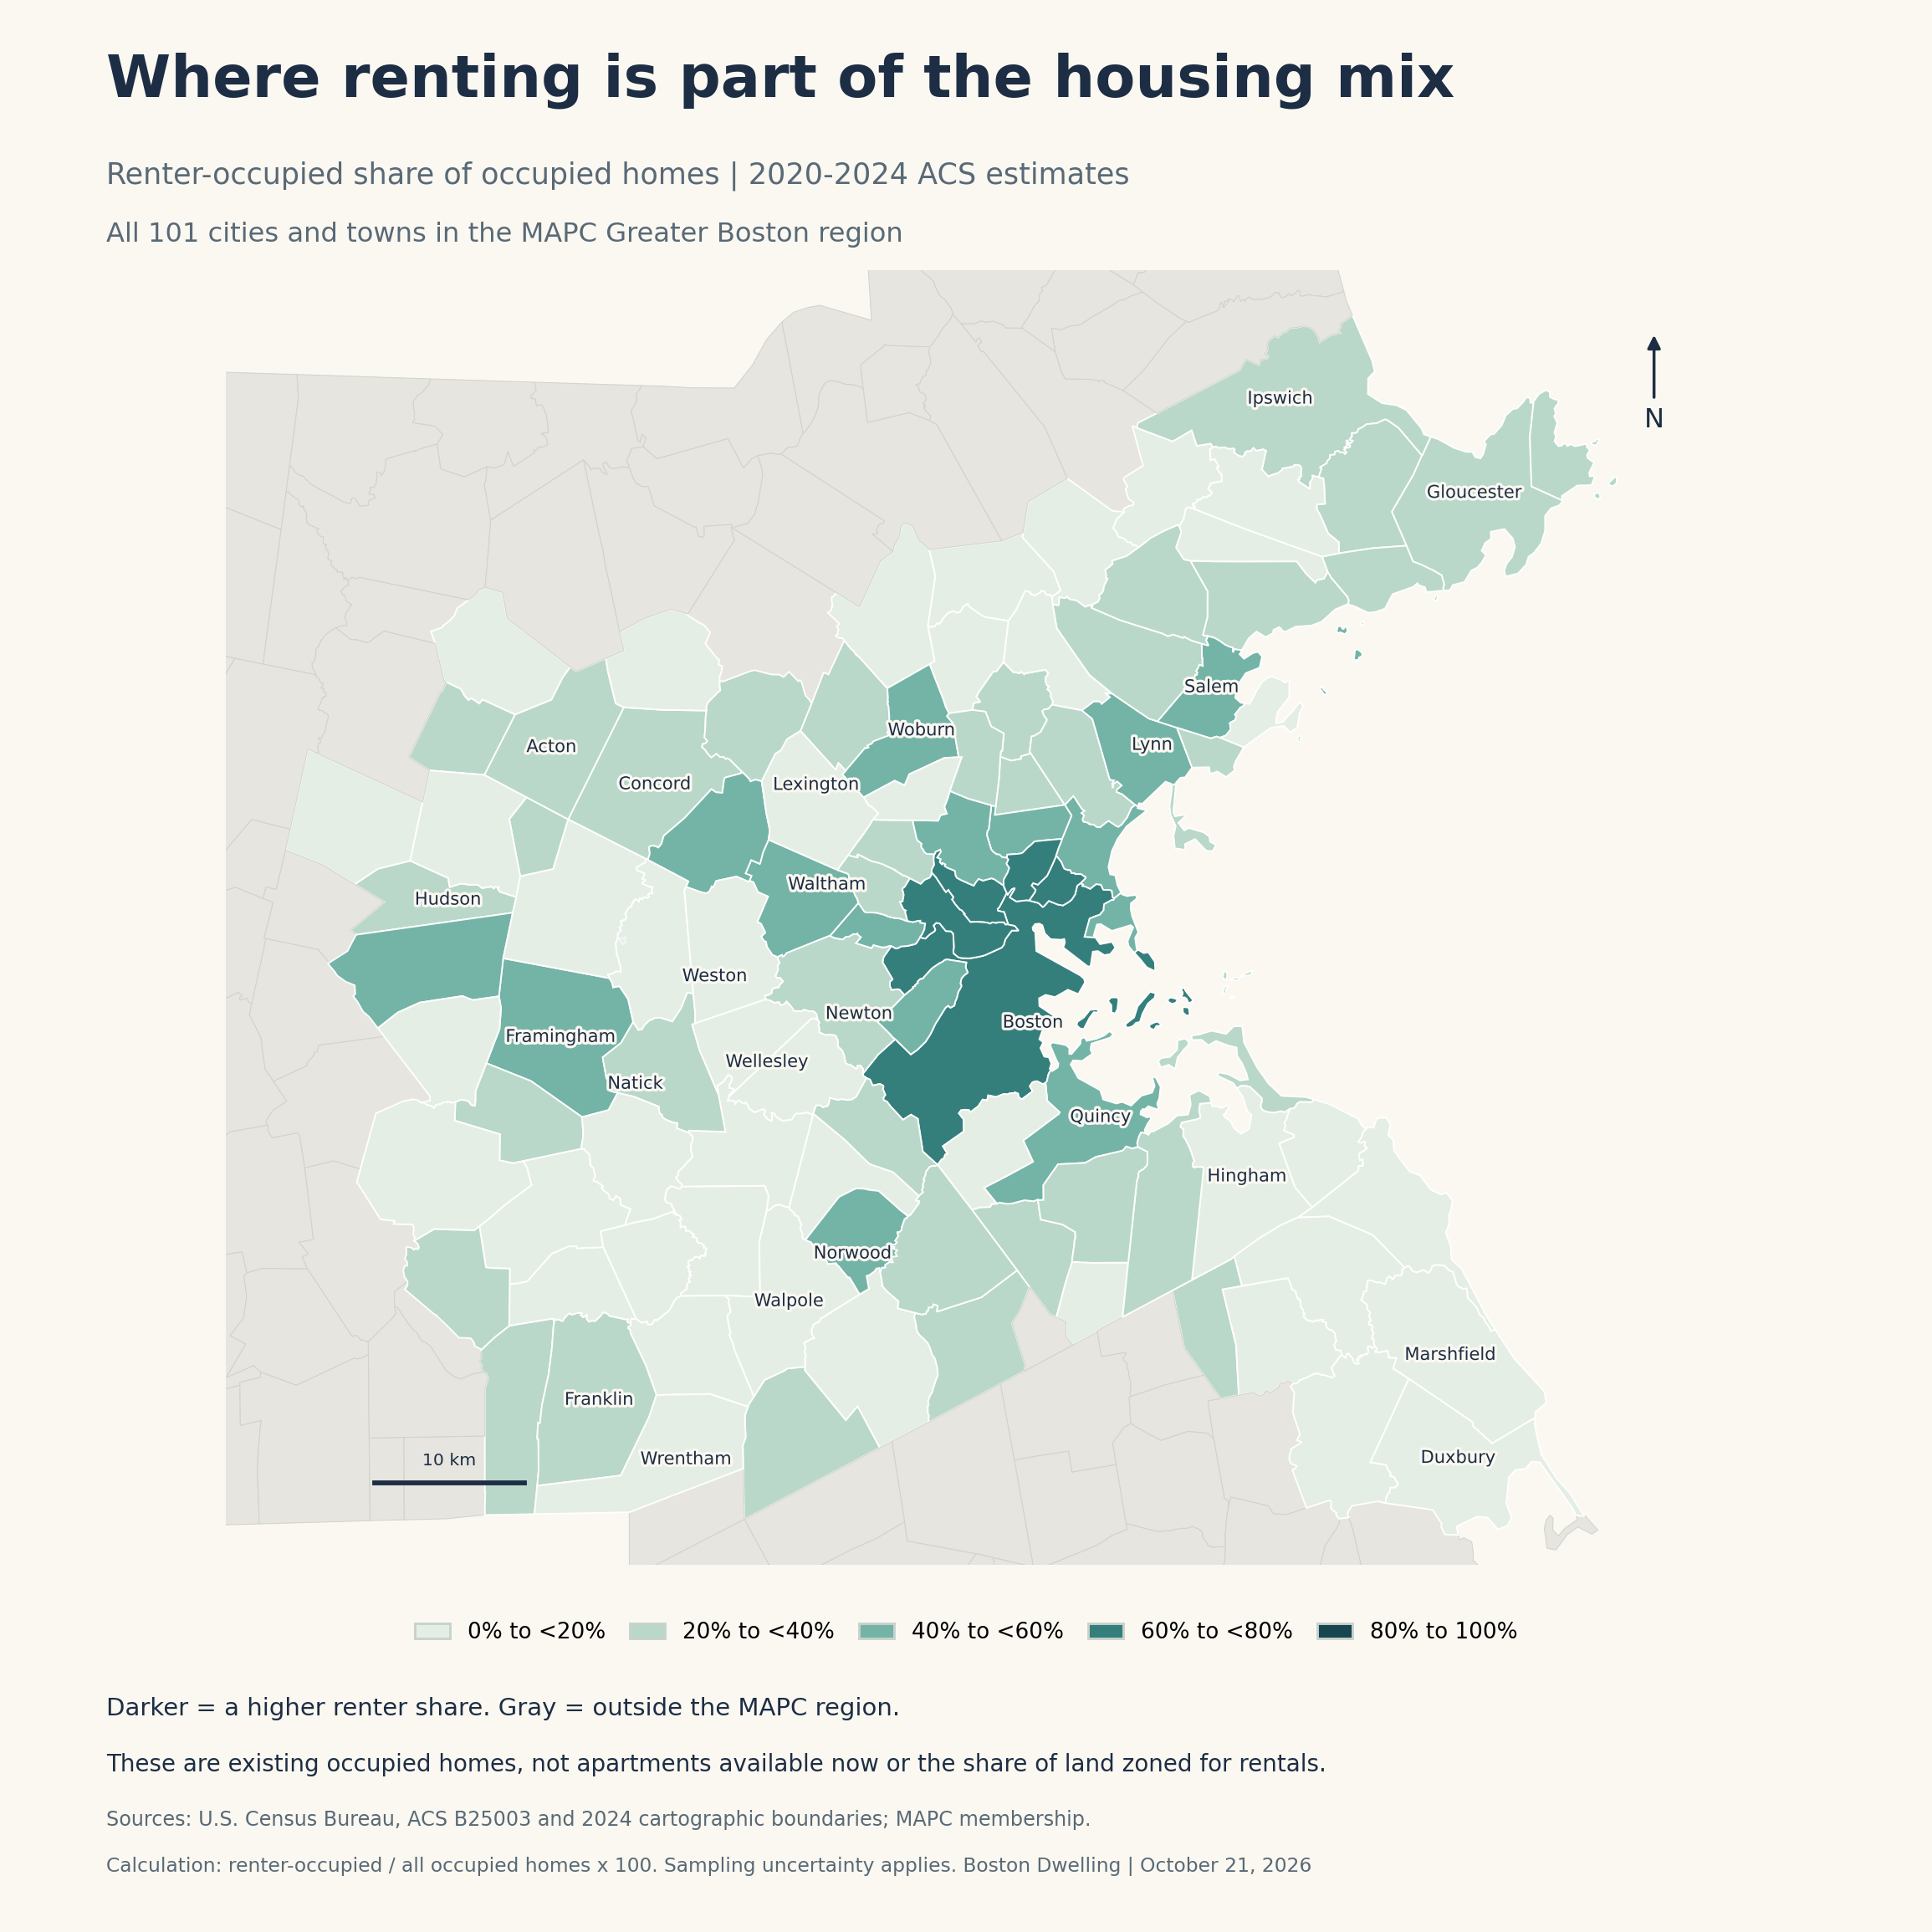
The regional map covers all 101 cities and towns (opens in a new tab) served by the Metropolitan Area Planning Council, or MAPC. Using the Census Bureau’s 2020-2024 American Community Survey estimates (opens in a new tab), Boston Dwelling calculated the share of occupied homes rented by tenants. The expanded bar chart compares 24 selected communities, and the complete alphabetical table at the end lets you find every community in the region.
Compare more communities
More communities, the same measure
24 selected MAPC municipalities · Observed 2020-2024 ACS five-year estimates · Illustration / estimate · Values in percent
Weston
Wellesley
Needham
Lexington
Newton
Natick
Melrose
Belmont
Arlington
Winthrop
Framingham
Medford
Salem
Waltham
Watertown
Brookline
Revere
Quincy
Malden
Everett
Boston
Somerville
Cambridge
Chelsea
Show the exact values
| Category | Value |
|---|---|
| Weston | 12.5% |
| Wellesley | 15.6% |
| Needham | 16.9% |
| Lexington | 19.5% |
| Newton | 30.0% |
| Natick | 31.8% |
| Melrose | 32.8% |
| Belmont | 35.3% |
| Arlington | 38.4% |
| Winthrop | 43.1% |
| Framingham | 45.2% |
| Medford | 45.9% |
| Salem | 50.3% |
| Waltham | 50.3% |
| Watertown | 52.3% |
| Brookline | 53.1% |
| Revere | 54.4% |
| Quincy | 54.8% |
| Malden | 58.7% |
| Everett | 62.8% |
| Boston | 64.3% |
| Somerville | 65.8% |
| Cambridge | 66.5% |
| Chelsea | 74.0% |
Selected comparison, not a complete regional ranking or a vacancy measure. The map and appendix include all 101 MAPC communities. Source: U.S. Census Bureau ACS B25003. Renter-occupied / occupied x 100. Sampling uncertainty applies.
Source: U.S. Census Bureau, ACS B25003: Tenure, complete 2024 five-year Summary File (2020-2024)
In Weston (opens in a new tab), about one in eight occupied homes was rented. In Waltham (opens in a new tab), it was about half. Newton (opens in a new tab) sat between those examples, at three in ten. These shares describe people already living in homes, so a rented apartment with a long-term tenant is included. They cannot tell you how many apartments will be listed before your lease ends.
For a renter, the useful distinction is between the size of that existing base and the openings that appear within it. Even a community with many rentals can have few suitable vacancies in a particular month. And a small rental share does not mean you should rule a town out. It means a thin search result may reflect the kinds of housing available there, alongside your budget and timing.
The housing choice that comes before the price
Researchers call neighborhoods with very little rental housing “rental deserts.” A December 2025 Boston Indicators analysis (opens in a new tab) identified 272 of 1,004 studied census tracts across its Greater Boston region using 2023 estimates. Its threshold was fewer than 20% of homes renter-occupied or available for rent. A census tract is a small statistical area, not necessarily a whole town.
That measure differs from our visuals: the report includes homes available for rent and studies tracts; our map and chart cover occupied homes across whole municipalities and a later five-year period. Our map also uses MAPC’s 101-community boundary, rather than the report’s larger 147-community region. The measures should not be used interchangeably to label a town or measure a change over time.
The everyday consequence is easy to recognize. If you need to rent to keep savings available, accommodate a temporary job or avoid buying before you are ready, a neighborhood dominated by ownership gives you fewer ways in. Someone who already owns a home there may see plenty of housing on the street. Someone looking for a lease is searching a much smaller part of it.
The reason reaches beyond an individual landlord. Harvard’s Joint Center for Housing Studies (opens in a new tab) found an association between restrictive land-use rules and neighborhoods with little rental housing. Multifamily buildings are more often rented, so limits on their construction can also limit where renters live. The researchers also found links with racial and economic segregation. This is evidence about patterns, not proof that zoning alone explains a particular town’s rental share.
What would give a renter another way in?
Massachusetts has a policy aimed at part of this barrier. The MBTA Communities law (opens in a new tab) requires covered communities to provide a district where multifamily housing is allowed as of right, meaning a qualifying proposal does not need a discretionary special permit for that use. The statute calls for housing without age restrictions that is suitable for families with children.
That zoning permission is an opening in the rules. A landlord or developer still has to finance and deliver homes, and the law does not give an apartment hunter a construction date, a lease or a particular rent. More rental options and rents affordable to lower-income households are related goals that also require attention to income restrictions, subsidies and the costs of building.
A useful local question follows: would this proposal let more kinds of households live here? Look for the number and size of rental homes, eligibility restrictions and an actual delivery stage. A building of studios may add useful options for one-person households while doing less for a family needing three bedrooms. The same total home count can answer very different needs.
For your own search, compare actual addresses across nearby communities before crossing places off the map. Keep bedroom count, total monthly cost and your real trip to work or family consistent. If you qualify for income-restricted housing, Housing Navigator Massachusetts (opens in a new tab) offers a separate search with property-specific eligibility and application information. Confirm whether a result is an opening, lottery or waiting list before relying on it for a move.
- Use the map and chart to understand the housing mix. Check live listings separately for your moving date and bedroom needs.
- Compare the whole move. A workable rent still has to fit the commute, utility costs and daily trips you will actually make.
- Ask what new housing would deliver. Look for rental tenure, unit sizes, income rules and construction progress, rather than treating zoning capacity as an available apartment.
A renter should be able to ask where they want to live before deciding whether they are ready to buy. Greater Boston’s housing choices do not yet make that equally easy in every community. Seeing the gap clearly is a start toward widening the choice.
Is there a Greater Boston town where you have struggled to find a place to rent? Email Here. Tell us what kind of home you were looking for and which part of the search was hardest.
| Municipality | Renter share | Renter homes | Occupied homes |
|---|---|---|---|
| Acton | 25.1% | 2,359 | 9,409 |
| Arlington | 38.4% | 7,680 | 20,005 |
| Ashland | 24.7% | 1,890 | 7,643 |
| Bedford | 31.2% | 1,830 | 5,869 |
| Bellingham | 21.1% | 1,340 | 6,346 |
| Belmont | 35.3% | 3,673 | 10,412 |
| Beverly | 39.9% | 6,768 | 16,980 |
| Bolton | 5.3% | 104 | 1,976 |
| Boston | 64.3% | 182,208 | 283,374 |
| Boxborough | 26.6% | 606 | 2,279 |
| Braintree | 22.4% | 3,233 | 14,432 |
| Brookline | 53.1% | 14,662 | 27,587 |
| Burlington | 25.8% | 2,572 | 9,974 |
| Cambridge | 66.5% | 32,897 | 49,444 |
| Canton | 26.4% | 2,539 | 9,630 |
| Carlisle | 6.4% | 113 | 1,776 |
| Chelsea | 74.0% | 10,148 | 13,716 |
| Cohasset | 17.0% | 515 | 3,037 |
| Concord | 24.3% | 1,599 | 6,590 |
| Danvers | 30.8% | 3,386 | 11,005 |
| Dedham | 26.6% | 2,801 | 10,530 |
| Dover | 2.1% | 40 | 1,917 |
| Duxbury | 8.8% | 538 | 6,130 |
| Essex | 25.0% | 340 | 1,359 |
| Everett | 62.8% | 10,967 | 17,466 |
| Foxborough | 26.3% | 1,875 | 7,134 |
| Framingham | 45.2% | 12,123 | 26,803 |
| Franklin | 21.8% | 2,699 | 12,370 |
| Gloucester | 36.1% | 4,847 | 13,444 |
| Hamilton | 15.3% | 405 | 2,644 |
| Hanover | 15.5% | 779 | 5,015 |
| Hingham | 19.3% | 1,873 | 9,689 |
| Holbrook | 16.0% | 703 | 4,384 |
| Holliston | 12.6% | 714 | 5,684 |
| Hopkinton | 13.3% | 889 | 6,660 |
| Hudson | 26.8% | 2,245 | 8,362 |
| Hull | 20.4% | 960 | 4,709 |
| Ipswich | 25.6% | 1,463 | 5,709 |
| Lexington | 19.5% | 2,435 | 12,477 |
| Lincoln | 42.7% | 1,149 | 2,693 |
| Littleton | 16.4% | 622 | 3,804 |
| Lynn | 51.9% | 18,892 | 36,414 |
| Lynnfield | 12.7% | 570 | 4,502 |
| Malden | 58.7% | 15,298 | 26,042 |
| Manchester-by-the-Sea | 25.3% | 546 | 2,156 |
| Marblehead | 14.8% | 1,228 | 8,289 |
| Marlborough | 44.0% | 7,329 | 16,665 |
| Marshfield | 19.2% | 1,996 | 10,416 |
| Maynard | 25.0% | 1,205 | 4,821 |
| Medfield | 13.9% | 652 | 4,680 |
| Medford | 45.9% | 11,180 | 24,339 |
| Medway | 14.1% | 671 | 4,744 |
| Melrose | 32.8% | 4,073 | 12,401 |
| Middleton | 7.3% | 230 | 3,172 |
| Milford | 34.8% | 3,906 | 11,234 |
| Millis | 16.8% | 555 | 3,309 |
| Milton | 14.8% | 1,348 | 9,094 |
| Nahant | 21.1% | 336 | 1,589 |
| Natick | 31.8% | 4,862 | 15,287 |
| Needham | 16.9% | 1,954 | 11,586 |
| Newton | 30.0% | 9,662 | 32,194 |
| Norfolk | 5.1% | 176 | 3,453 |
| North Reading | 15.7% | 913 | 5,825 |
| Norwell | 8.4% | 310 | 3,685 |
| Norwood | 46.0% | 6,104 | 13,259 |
| Peabody | 34.4% | 7,702 | 22,390 |
| Pembroke | 9.9% | 684 | 6,900 |
| Quincy | 54.8% | 24,794 | 45,285 |
| Randolph | 28.7% | 3,663 | 12,747 |
| Reading | 17.6% | 1,712 | 9,740 |
| Revere | 54.4% | 12,075 | 22,178 |
| Rockland | 23.5% | 1,623 | 6,897 |
| Rockport | 31.7% | 1,026 | 3,238 |
| Salem | 50.3% | 10,194 | 20,267 |
| Saugus | 28.5% | 3,122 | 10,958 |
| Scituate | 12.2% | 943 | 7,705 |
| Sharon | 12.3% | 788 | 6,393 |
| Sherborn | 10.8% | 166 | 1,532 |
| Somerville | 65.8% | 23,483 | 35,715 |
| Southborough | 11.8% | 447 | 3,777 |
| Stoneham | 29.0% | 2,826 | 9,749 |
| Stoughton | 25.9% | 2,932 | 11,302 |
| Stow | 14.6% | 406 | 2,773 |
| Sudbury | 10.1% | 634 | 6,297 |
| Swampscott | 24.1% | 1,486 | 6,155 |
| Topsfield | 9.6% | 210 | 2,186 |
| Wakefield | 29.3% | 3,302 | 11,270 |
| Walpole | 16.5% | 1,543 | 9,372 |
| Waltham | 50.3% | 12,828 | 25,498 |
| Watertown | 52.3% | 8,557 | 16,371 |
| Wayland | 12.4% | 627 | 5,062 |
| Wellesley | 15.6% | 1,432 | 9,174 |
| Wenham | 14.3% | 183 | 1,279 |
| Weston | 12.5% | 472 | 3,776 |
| Westwood | 12.7% | 710 | 5,592 |
| Weymouth | 32.6% | 8,388 | 25,759 |
| Wilmington | 11.9% | 947 | 7,926 |
| Winchester | 18.3% | 1,529 | 8,340 |
| Winthrop | 43.1% | 3,401 | 7,899 |
| Woburn | 44.3% | 7,286 | 16,432 |
| Wrentham | 18.0% | 780 | 4,339 |
2020-2024 ACS estimates. Renter share = renter-occupied homes / all occupied homes x 100. Counts are estimates of existing occupied homes, not available apartments. Percentages rounded to one decimal; sampling uncertainty applies.